Fig. 1
Download original image
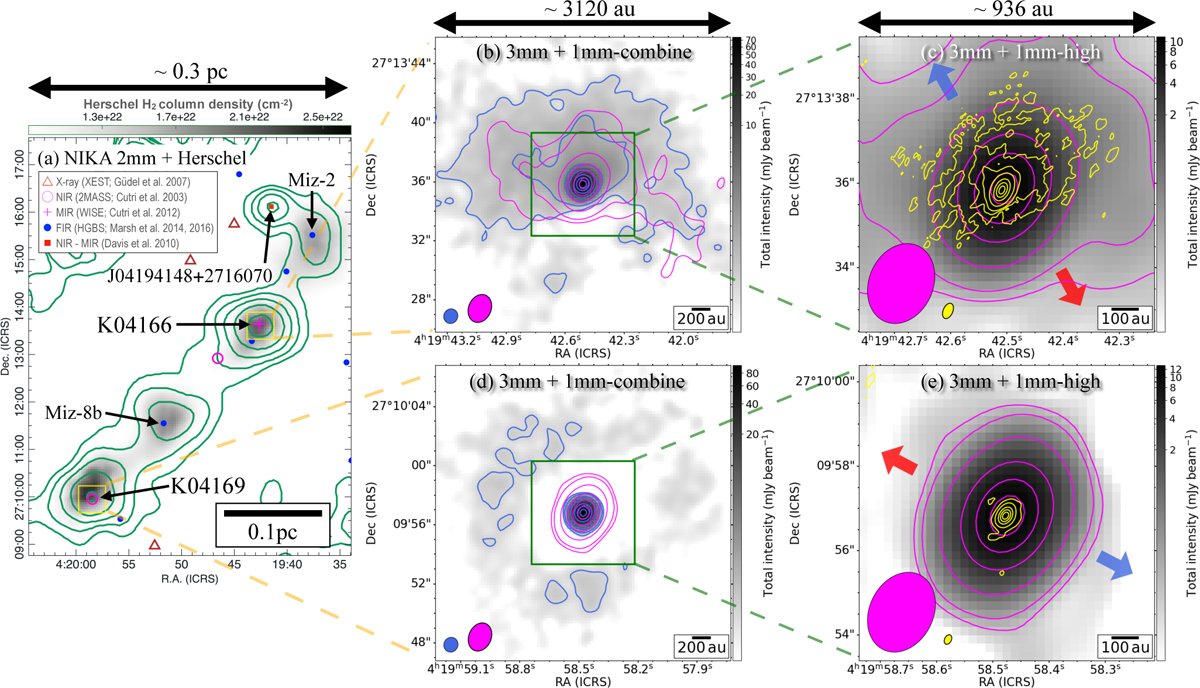
Overview of Stokes I dust continuum emission at different scales. Panel a: previous observations toward B213. Green contours represent the 2 mm dust continuum emission derived from IRAM-30m/NIKA at the contour levels of [2, 5, 10, 20] × 0.068 MJy sr−1 (Bracco et al. 2017). Background grayscale represents the Herschel H2 column density map. The symbols point to the source positions previously identified with X-ray (red triangles; Güdel et al. 2007), near-IR (NIR: magenta open circle; Cutri et al. 2003), mid-IR (MIR: magenta cross; Cutri et al. 2012), and FIR (blue filled circles; Marsh et al. 2014, 2016), along with a T-Tauri source identified based on NIR-MIR (the red filled square; Davis et al. 2010). Panels b and d: zoom-in images of each source at ∼3000 au scale. Background grayscale and blue contours represent the total intensity of the 1 mm-combine continuum emission, with its contour levels of [3, 8, 30, 100, 300, 500, 700]×89µJy beam−1 in panel b and [3, 8, 30, 100, 300, 500, 700]×116µJy beam−1 in panel d. The magenta contours represent the total intensity of the 3mm continuum, and the contour levels are [5, 10, 50, 200, 400, 600]×17µJy beam−1 in panel b and [5, 10, 50, 200, 400, 600]×18µJy beam−1 in panel d. The blue and magenta ellipses at the bottom left correspond to the synthesized beam of the 1 mm-combine and 3 mm maps in both panels. Panels c and e: zoom-in images of panels b and d at ∼900 au scale. Grayscale and the magenta contours represent the total intensity of the 3mm data, and the contour levels are the same as panels b and d. Yellow contours represent the total intensity of the 1 mm-high continuum, at [5, 10, 20, 100, 500, 1000, 1500, 2000, 2500, 3000]×33µJy beam−1 levels in panel c and [5, 100, 500, 1000, 1500, 2000, 2500, 3000]×28µJy beam−1 levels in panel e. Red and blue arrows represent directions of red-and blue-shifted 12CO outflow lobes with position angle of 32◦ for K04166 (Narayanan et al. 2012) and 64◦ for K04169 (Takakuwa et al. 2018). Magenta and yellow ellipses at the bottom left correspond to the synthesized beam of the 3 mm and 1 mm-high maps in both panels. Root-mean-square (rms) values of the contours are listed in Table A.2.
Current usage metrics show cumulative count of Article Views (full-text article views including HTML views, PDF and ePub downloads, according to the available data) and Abstracts Views on Vision4Press platform.
Data correspond to usage on the plateform after 2015. The current usage metrics is available 48-96 hours after online publication and is updated daily on week days.
Initial download of the metrics may take a while.