Fig. 2
Download original image
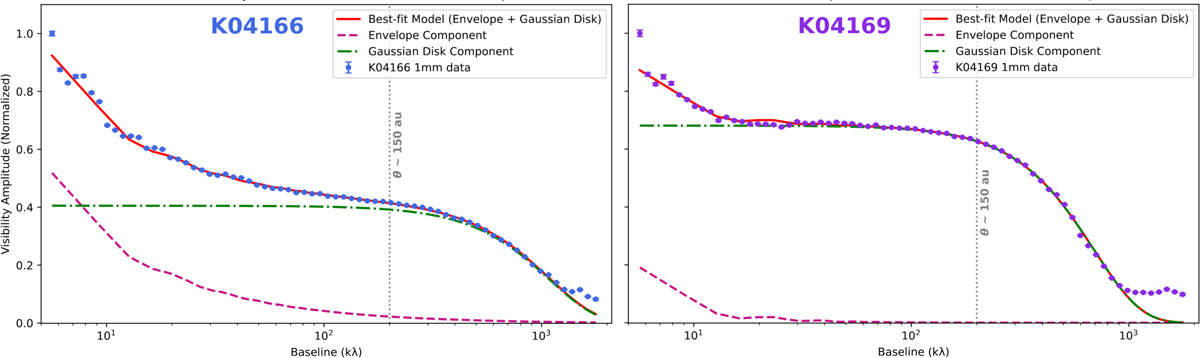
1.4 mm dust continuum emission visibility amplitudes as a function of baseline length (circularly averaged in logarithmically spaced bins), for both K04166 (left) and K04169 (right). The visibility amplitudes were derived from 1 mm-combine data and are normalized to the highest flux (at a baseline 5.6 kλ), for comparison purposes. A logarithmic scale is used for the uv-distance, as it encompasses several orders of magnitude, to enhance the visibility of all data points. The profiles of the two sources are shown, with associated error bars reflecting the dispersion of amplitudes in the bin and the best-fit models combining a Plummer envelope and a Gaussian disk are shown as the red curves on top of the data points.
Current usage metrics show cumulative count of Article Views (full-text article views including HTML views, PDF and ePub downloads, according to the available data) and Abstracts Views on Vision4Press platform.
Data correspond to usage on the plateform after 2015. The current usage metrics is available 48-96 hours after online publication and is updated daily on week days.
Initial download of the metrics may take a while.