Fig. 3
Download original image
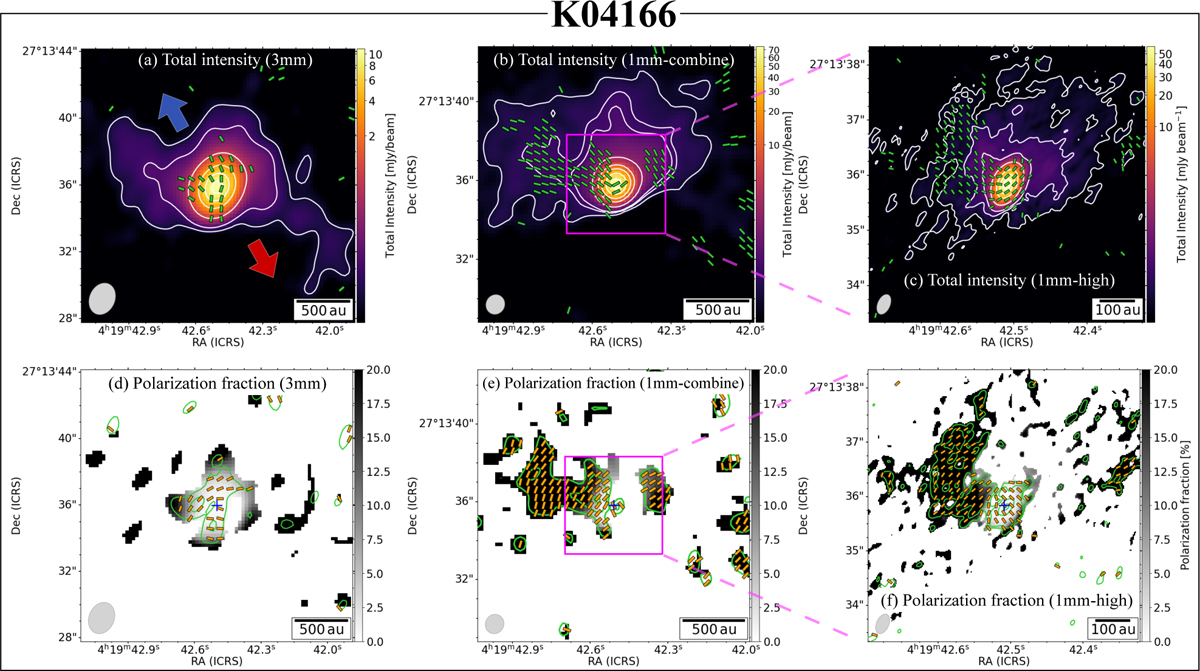
Polarization properties for K04166; 3 mm at ∼230 au resolution (panels a and d), 1 mm-combine at the ∼156 au resolution (panels b and e), and 1 mm-high at ∼36 au resolution (panels c and f). Top row: total intensity at [5, 10, 50, 200, 400, 600]×17 µJy beam−1, [5, 8, 10, 30, 100, 200, 400, 700]×89 µJy beam−1, and [5, 10, 20, 100, 500, 1000, 1500, 2000, 2500, 3000]×33 µJy beam−1 in panels a, b, and c, respectively, shown as the color scale and white contours. The green segments denote the B-vectors. The 1σ for the white contours are listed in Table A.2. The blue and red arrows in panel a indicate the direction of the blue- and red-shifted outflow lobes. The magenta square in panel b corresponds to the map size in panels c and f, respectively. The map size is the same between panels a, b, d, and e. Bottom row: Polarization fraction and polarized intensity, respectively, shown as the grayscale and green contours. The contour levels are [3, 5]×16 µJy beam−1, [3, 5, 8]×47µJy beam−1, and [3, 5, 15, 30]×18 µJy beam−1 in panels d, e, and f, respectively. The blue crosses point to the peak of total intensity of the same data as in the top row. The orange segments are the polarization vectors, perpendicular to the B-vectors in the top panel. The synthesized beam is presented at the bottom left side of each panel. We note that all segments in this paper are shown at fixed lengths, which do not relate to the polarization fraction value, as the following figures in this paper also present the segments with a fixed length.
Current usage metrics show cumulative count of Article Views (full-text article views including HTML views, PDF and ePub downloads, according to the available data) and Abstracts Views on Vision4Press platform.
Data correspond to usage on the plateform after 2015. The current usage metrics is available 48-96 hours after online publication and is updated daily on week days.
Initial download of the metrics may take a while.