Fig. 5
Download original image
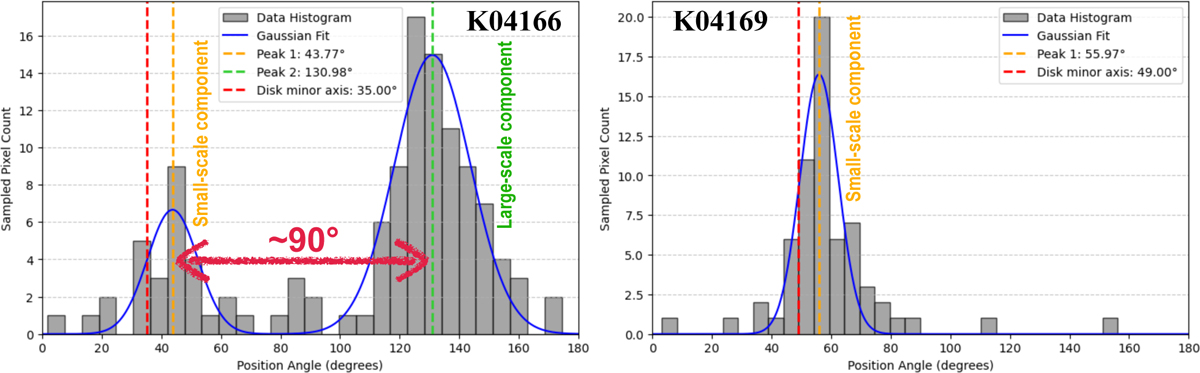
Histogram of position angles of the polarization vector around the disks, i.e., from the 1 mm-high data. Left: histogram for K04166 with a two-component Gaussian fitting denoted by the blue solid line. The gray-shaded bins were derived within a circle with a radius of 1.5 ″from the peak position in the total intensity, covering the extended polarized emission around the source. The dashed yellow and green vertical lines point to the position angles at the fitting peaks. The dashed red vertical line corresponds to the disk’s minor axis in the continuum data (Table 1). Right: histogram for K04169 with a one-component Gaussian fitting denoted by the blue solid line. The gray-shaded bins were derived within a circle with a radius of 0.5″from the peak position in the total intensity covering the compact structure in polarized intensity associated with K04169. The dashed yellow and red vertical lines are the same as those in the left panel.
Current usage metrics show cumulative count of Article Views (full-text article views including HTML views, PDF and ePub downloads, according to the available data) and Abstracts Views on Vision4Press platform.
Data correspond to usage on the plateform after 2015. The current usage metrics is available 48-96 hours after online publication and is updated daily on week days.
Initial download of the metrics may take a while.