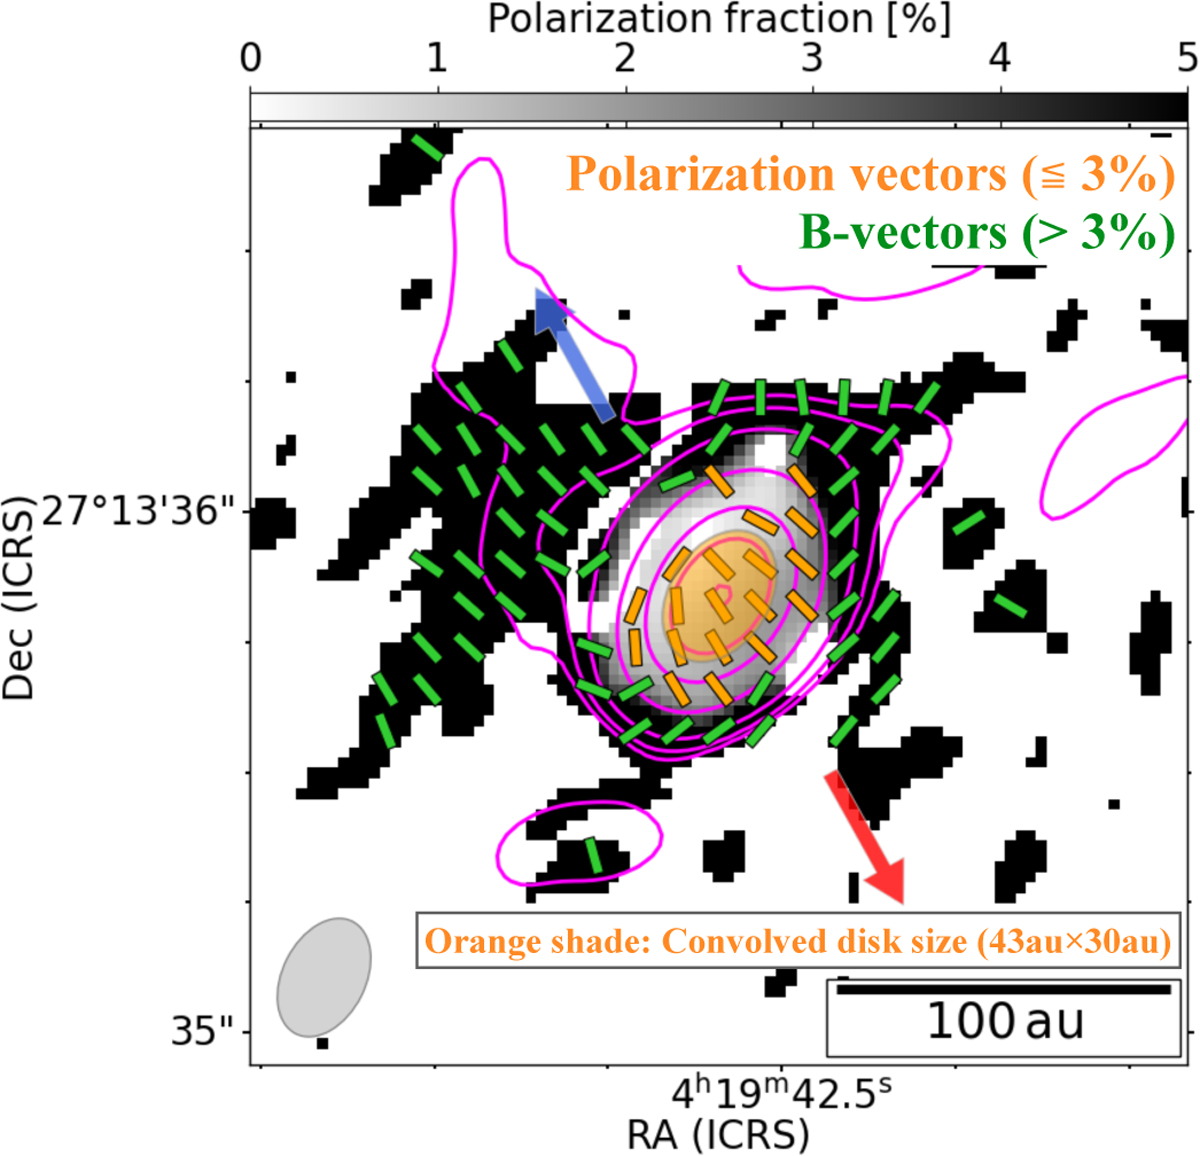
Fig. 6
Download original image
Central region of K04166 obtained from the 1 mm-high data with Briggs weighting. The background grayscale represents the polarization fraction, and the magenta contour represents the total intensity at [10, 20, 50, 200, 600, 1200, 2000]×25 µJy beam−1 levels. The orange segments correspond to the polarization vectors within the area where the fraction is lower than 3%, whereas the green segments correspond to the 90◦ flipped polarization vectors, B-vectors, within the area where the fraction is larger than 3%. The orange-shaded ellipse corresponds to the convolved size obtained with 2D Gaussian fitting. The contour at 200×25 µJy beam−1 levels is comparable to the transition area of 3%, which has the projected size of ∼0.51″×0.36 ″(80 au×56 au). The blue and red arrows are the outflow direction, and the gray ellipse corresponds to the beam.
Current usage metrics show cumulative count of Article Views (full-text article views including HTML views, PDF and ePub downloads, according to the available data) and Abstracts Views on Vision4Press platform.
Data correspond to usage on the plateform after 2015. The current usage metrics is available 48-96 hours after online publication and is updated daily on week days.
Initial download of the metrics may take a while.