Fig. 7
Download original image
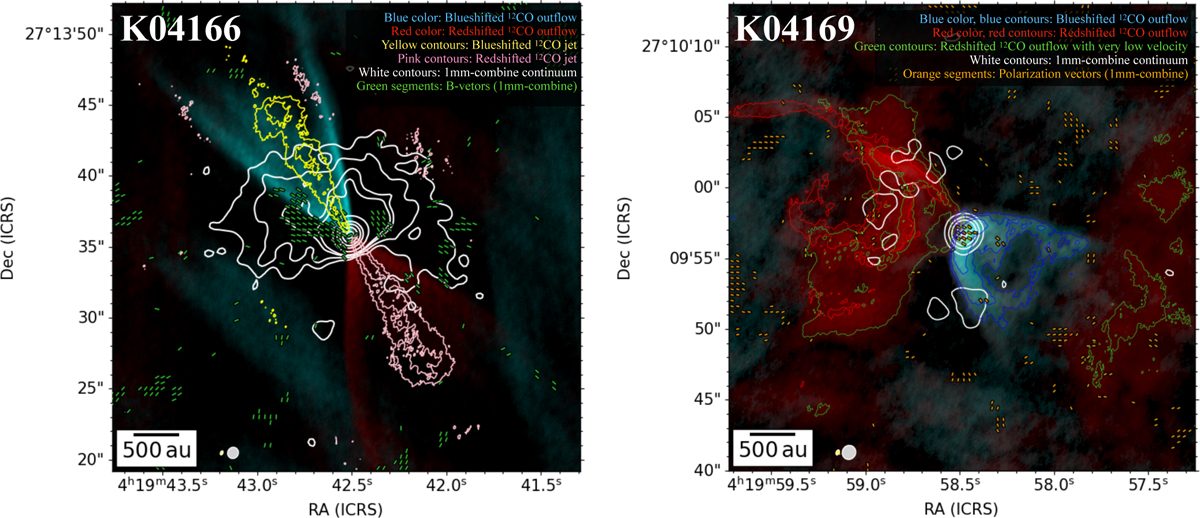
Dust polarization and the molecular outflows and jets obtained from our observation (presented in future literature). Left: blueshifted 12CO outflow indicated by the background cyan color. This represents the moment-0 map obtained from the 1 mm-high 12CO(2–1) line data (–7 to 5 km s−1). The background red color indicates the redshifted 12CO outflow, corresponding to the same data, but across a different velocity range (7–20 km s−1). The yellow contours represent the blueshifted 12CO jet, obtained from the same data (–50 to –35 km s−1) at 30% and 60% of the maximum value of the moment-0 map. In contrast, the pink contours depict the redshifted 12CO jet, from the same data with a velocity range of 45–58 km s−1, at 30% and 60% levels of the maximum value. The white contours illustrate the 1 mm-combine continuum emission at levels of [3, 5, 8, 10, 30, 100, 200, 400, 700]×89 µJy beam−1. We adopted the systemic velocity of 6.7 km s−1 (Tafalla et al. 2017). The green segments indicate the B-vectors from the 1 mm-combine map (as shown in panel b of Fig. 3). Right: blueshifted 12CO outflow with a moment-0 map from the 1 mm-high 12CO(2–1) data in a velocity range of –3 to 6 km s−1, again represented by the background. The background red color displays the redshifted 12CO outflow, with data collected in a velocity range of 7–16 km s−1. The blue contours highlight the blueshifted 12CO outflow, derived from the same data with a velocity range of –3 to 6 km s−1, with contour levels set at 10%, 20%, and 40% of the maximum value. The red contours depict the redshifted 12CO outflow for the velocity range of 11 to 16 km s−1, with contour levels at 20% and 50% of the maximum value. Additionally, the green contours represent the redshifted low-velocity outflow, obtained from data with a velocity range of 7.5 to 10 km s−1, with contour levels of 20% and 40% of the maximum value. We adopted the systemic velocity of 6.9 km s−1 (Han et al. 2025). The white contours display the 1 mm combined continuum emission at levels of [3, 30, 100, 400, 700]×116 µJy beam−1, while the orange segments correspond to the polarization vectors obtained from the 1 mm-combine data, as shown in panel b of Fig. 4. In both maps, the yellow and gray ellipses at the bottom left present the synthesized beam of the 12CO data (0.38″ × 0.23″, –23◦) and the 1 mm-combine data, respectively.
Current usage metrics show cumulative count of Article Views (full-text article views including HTML views, PDF and ePub downloads, according to the available data) and Abstracts Views on Vision4Press platform.
Data correspond to usage on the plateform after 2015. The current usage metrics is available 48-96 hours after online publication and is updated daily on week days.
Initial download of the metrics may take a while.