Fig. 8
Download original image
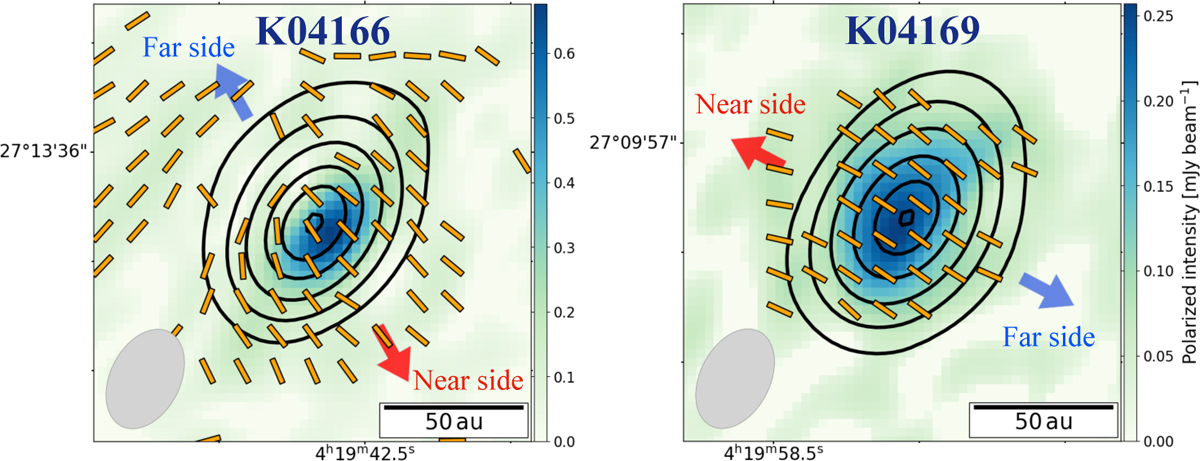
Disk nearside-farside asymmetry between total and polarized intensities obtained from 1 mm-high data. Left: polarized intensity map of K04166 in color with the total intensity (the black contours at [50, 200, 500, 1000, 1500, 2000]×25 µJy beam−1 levels) and polarization vectors (the orange segments). The blue and red arrows and the gray solid ellipse are the same as Fig. 6. Right: polarized intensity map of K04169 in color with the total intensity (the black contours at [50, 200, 500, 1000, 1500, 1850]×28 µJy beam−1 levels) and polarization vectors (the orange segments). The blue and red arrows and the gray solid ellipse are the same as Fig. 4.
Current usage metrics show cumulative count of Article Views (full-text article views including HTML views, PDF and ePub downloads, according to the available data) and Abstracts Views on Vision4Press platform.
Data correspond to usage on the plateform after 2015. The current usage metrics is available 48-96 hours after online publication and is updated daily on week days.
Initial download of the metrics may take a while.