Open Access
Fig. 3.
Download original image
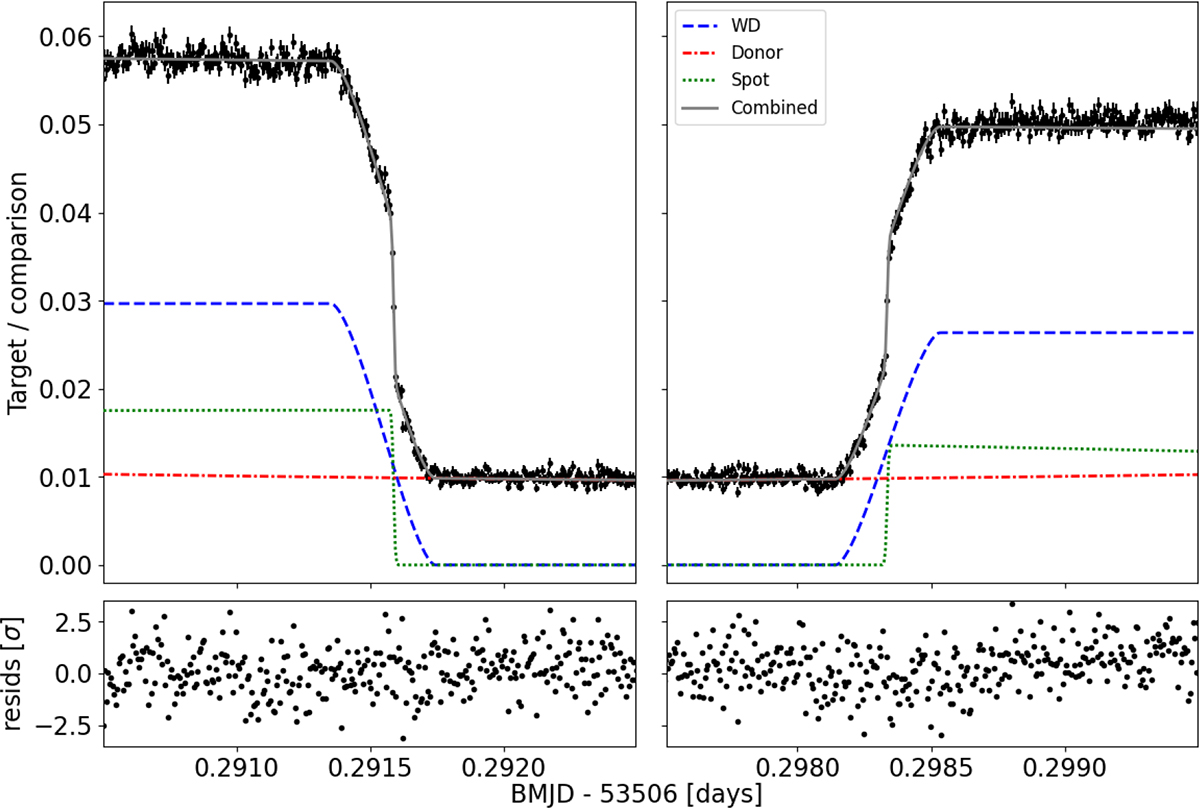
ULTRACAM r-band eclipse light curve from 16 May 2005 with best-fit model shown in gray. The individual components of the model are also shown: white dwarf (blue dashed line), donor star (red dot-dashed line), cyclotron spot (green dotted line). The residuals are shown below (in standard deviations).
Current usage metrics show cumulative count of Article Views (full-text article views including HTML views, PDF and ePub downloads, according to the available data) and Abstracts Views on Vision4Press platform.
Data correspond to usage on the plateform after 2015. The current usage metrics is available 48-96 hours after online publication and is updated daily on week days.
Initial download of the metrics may take a while.