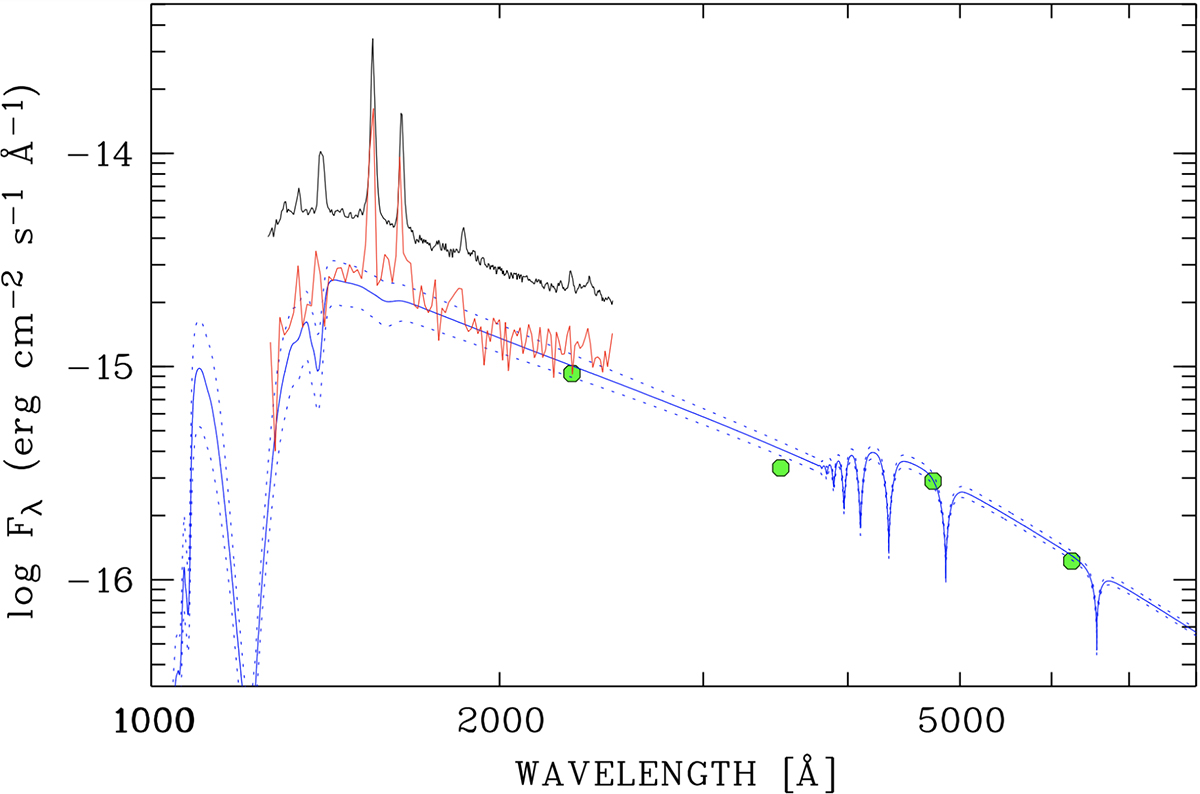
Fig. 5.
Download original image
UV to optical spectral energy distribution of HU Aqr. Shown are the faint-phase data only, the accretion steam-corrected HST/FOS spectrum obtained 1996, and the OM data obtained simultaneously with the ULTRACAM u, g, r photometry. The model spectra for 13 500 K, 14 000 K, and 14 500 K scaled to the distance and radius of the white dwarf in HU Aqr are shown as blue lines.
Current usage metrics show cumulative count of Article Views (full-text article views including HTML views, PDF and ePub downloads, according to the available data) and Abstracts Views on Vision4Press platform.
Data correspond to usage on the plateform after 2015. The current usage metrics is available 48-96 hours after online publication and is updated daily on week days.
Initial download of the metrics may take a while.