Open Access
Fig. 7.
Download original image
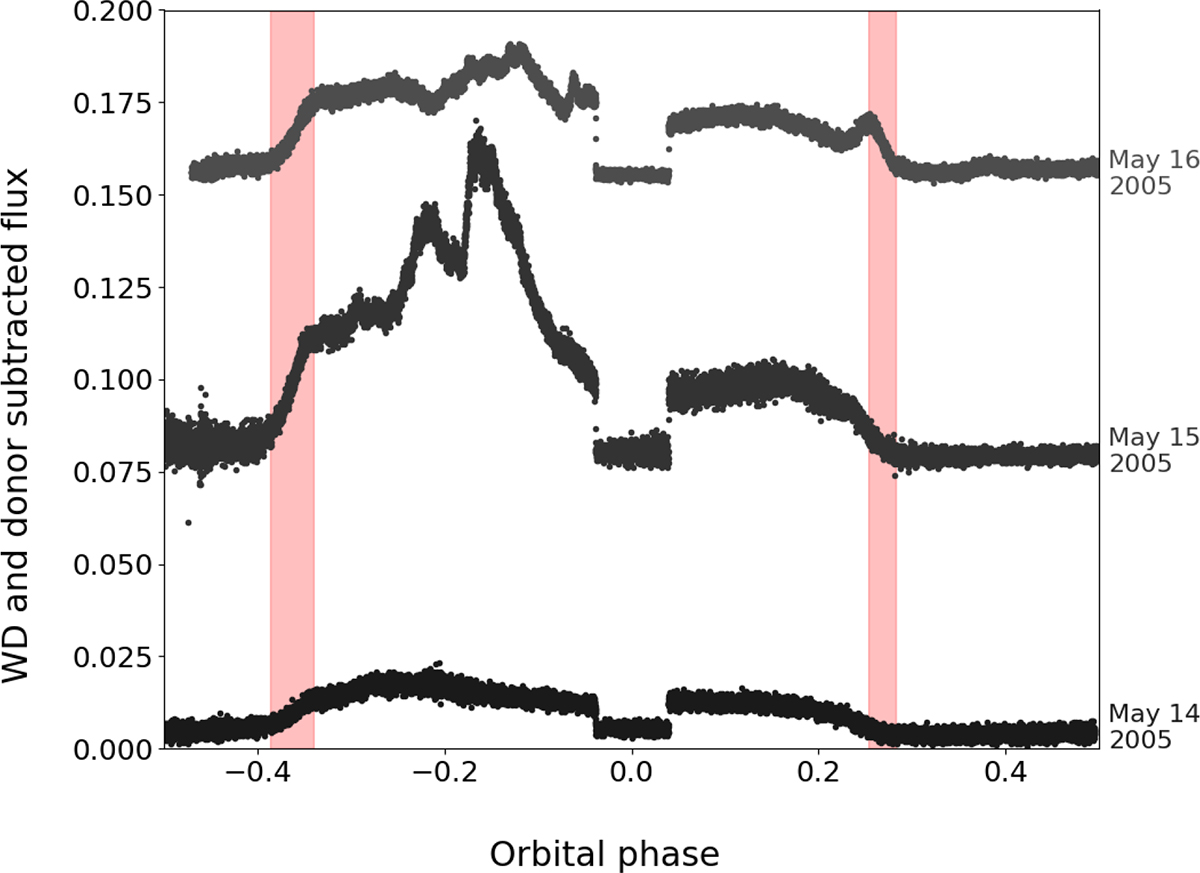
Three ULTRACAM r-band light curves of HU Aqr with the white dwarf and donor star contributions subtracted. Each curve is offset vertically by 0.075 for clarity. The shaded pink regions indicate the approximate phases where the additional variability appears and disappears on 16 May 2005.
Current usage metrics show cumulative count of Article Views (full-text article views including HTML views, PDF and ePub downloads, according to the available data) and Abstracts Views on Vision4Press platform.
Data correspond to usage on the plateform after 2015. The current usage metrics is available 48-96 hours after online publication and is updated daily on week days.
Initial download of the metrics may take a while.