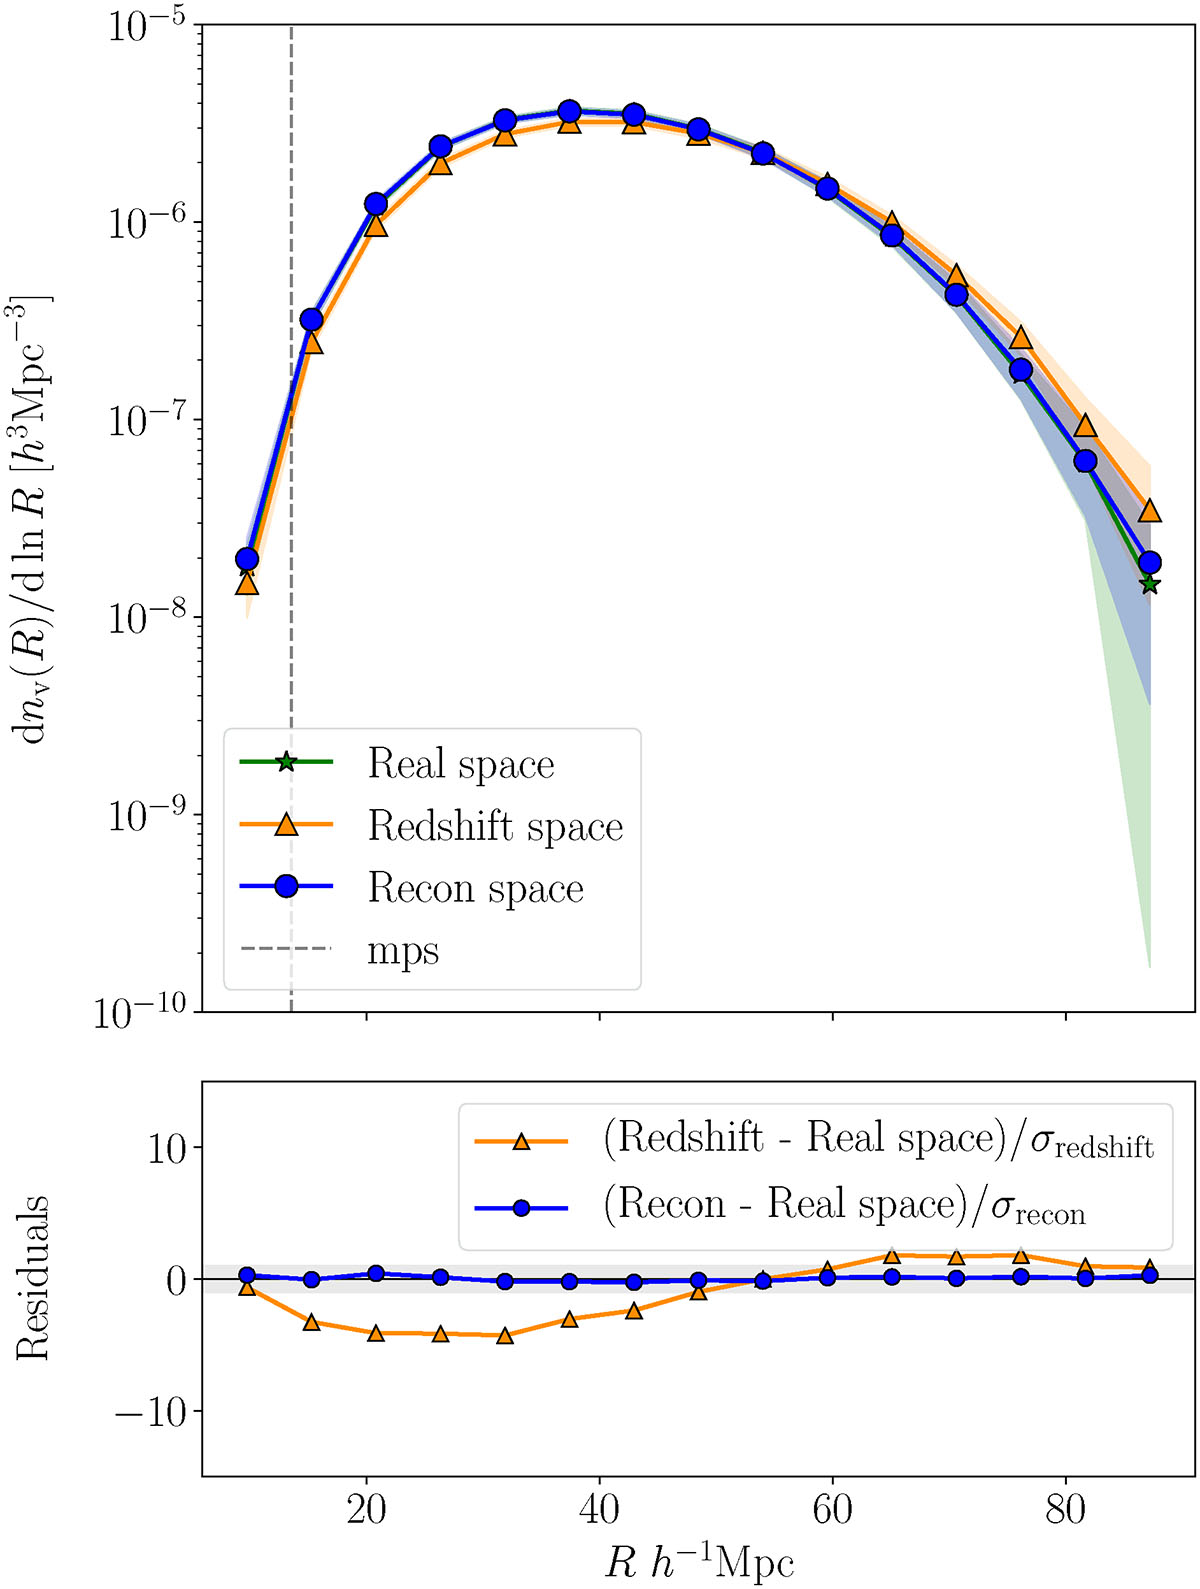
Fig. 1.
Download original image
Top Panel: number density of voids per unit radius interval, i.e., the void size function, of the cmttVIDE voids found in real (green stars), redshift (orange triangles), and reconstructed (blue dots) space as a function of their effective radius R, averaged over 100 mocks; shaded bands show the 1σ standard deviation across mocks. The dashed line marks the mean tracer separation of the halo simulations. Bottom Panel: residuals divided by 1σ standard deviation relative to real space, redshift – real (orange) and reconstructed – real (blue), showing reconstructed space agrees more closely with real space. The grey band indicates the [ − 1, 1] σ interval.
Current usage metrics show cumulative count of Article Views (full-text article views including HTML views, PDF and ePub downloads, according to the available data) and Abstracts Views on Vision4Press platform.
Data correspond to usage on the plateform after 2015. The current usage metrics is available 48-96 hours after online publication and is updated daily on week days.
Initial download of the metrics may take a while.