Fig. A.8.
Download original image
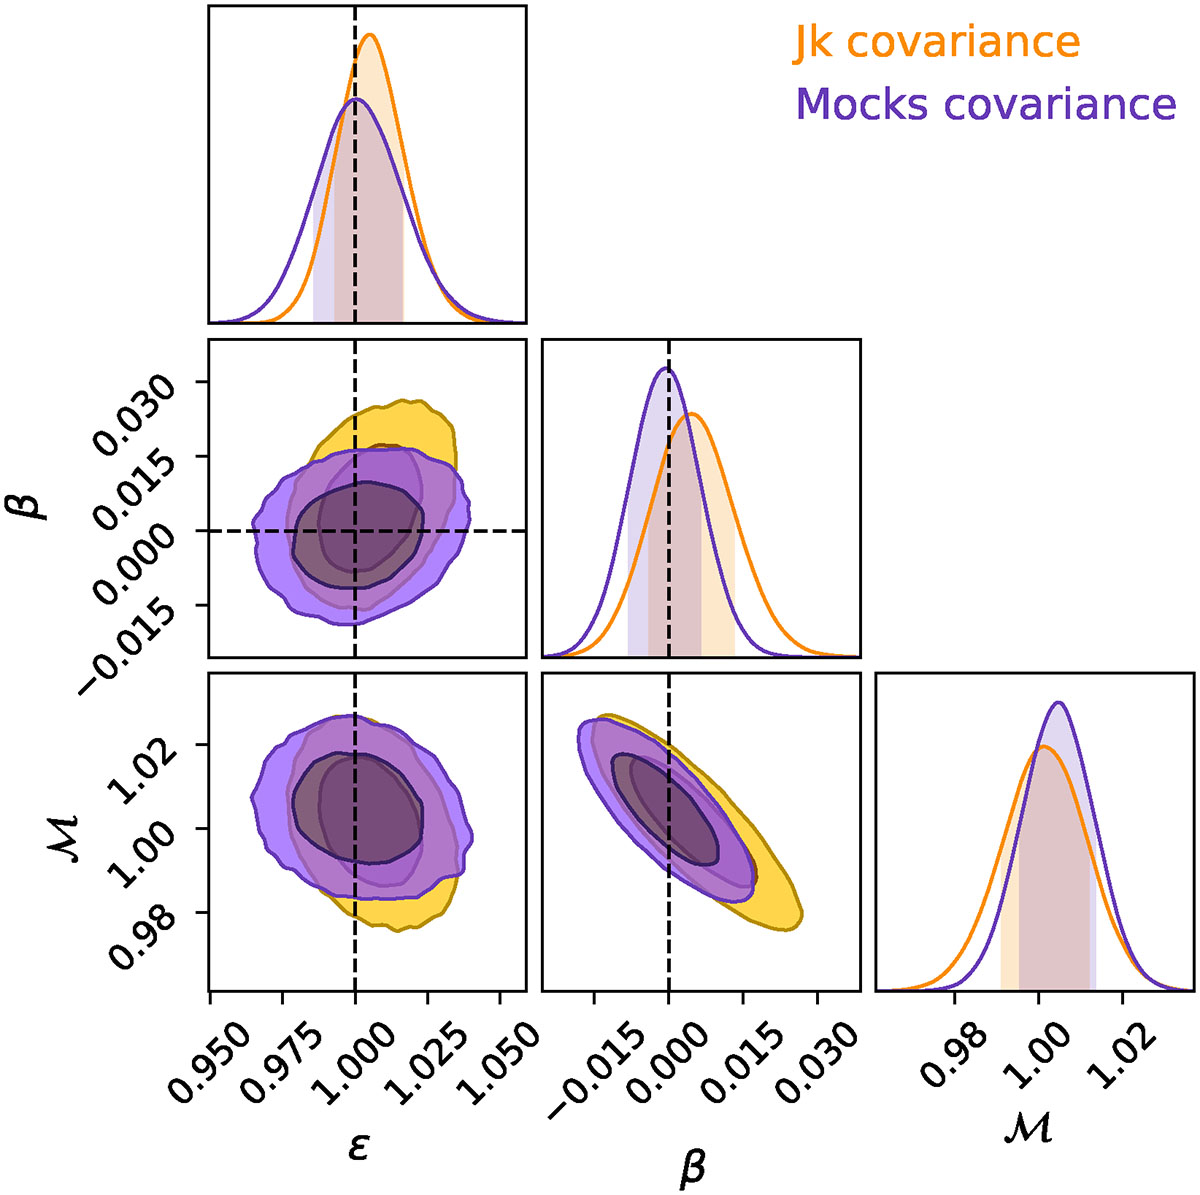
Posterior probability distribution of the model parameters computed with the likelihood analysis presented in Section 4, from the data of the single mock (mock 0), obtained using two different covariance matrices. Orange: jackknife resampling covariance matrix, and purple: mock covariance matrix corrected with factors proposed by (Hartlap et al. 2006) and (Percival et al. 2014). Dark and light-shaded areas represent 68% and 95% confidence regions, and dashed lines indicate fiducial values of the RSD and AP parameters β and ε.
Current usage metrics show cumulative count of Article Views (full-text article views including HTML views, PDF and ePub downloads, according to the available data) and Abstracts Views on Vision4Press platform.
Data correspond to usage on the plateform after 2015. The current usage metrics is available 48-96 hours after online publication and is updated daily on week days.
Initial download of the metrics may take a while.