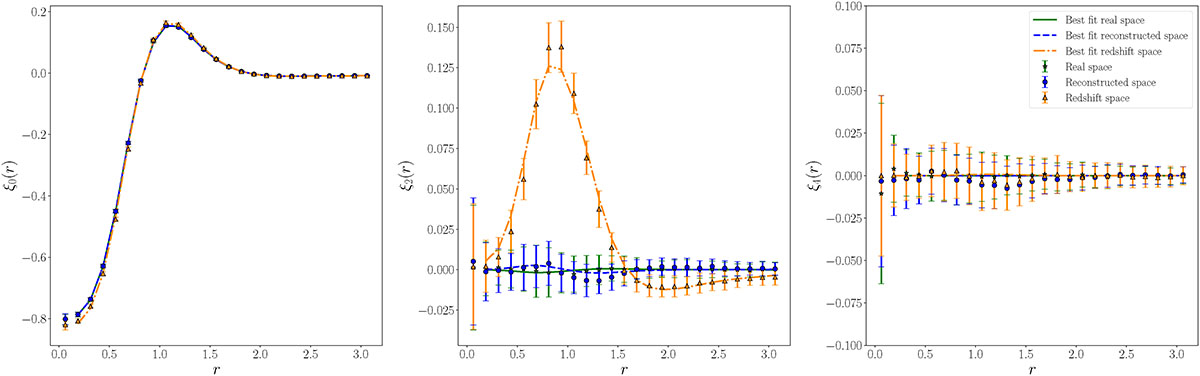
Fig. 2.
Download original image
Monopole (left), quadrupole (center) and hexadecapole (right) of the average VGCF measured for the 100 mocks, in redshift space (orange triangles), reconstructed space (blue dots) and real space (green stars) together with the associated best-fit models (blue dashed lines for reconstructed space, orange dash dotted lines for redshift space, and green solid line for real space) estimated via the likelihood analysis presented in Section 4. Error bars represent the standard deviation among the 100 mocks. In the left panel, the monopole represents the density profile of halos inside the void region, and it is quite similar in all the three cases (real, redshift and reconstructed space). In the middle panel, the quadrupole is visibly influenced by RSD in redshift space (orange), while in reconstructed space (blue) and real space (green), it is distortion-free and consistent with zero. The hexadecapole is 0 in both redshift and reconstructed space. Here r is a dimensionless quantity representing the physical separation between the center of the void and the halo, normalized by the void effective radius R.
Current usage metrics show cumulative count of Article Views (full-text article views including HTML views, PDF and ePub downloads, according to the available data) and Abstracts Views on Vision4Press platform.
Data correspond to usage on the plateform after 2015. The current usage metrics is available 48-96 hours after online publication and is updated daily on week days.
Initial download of the metrics may take a while.