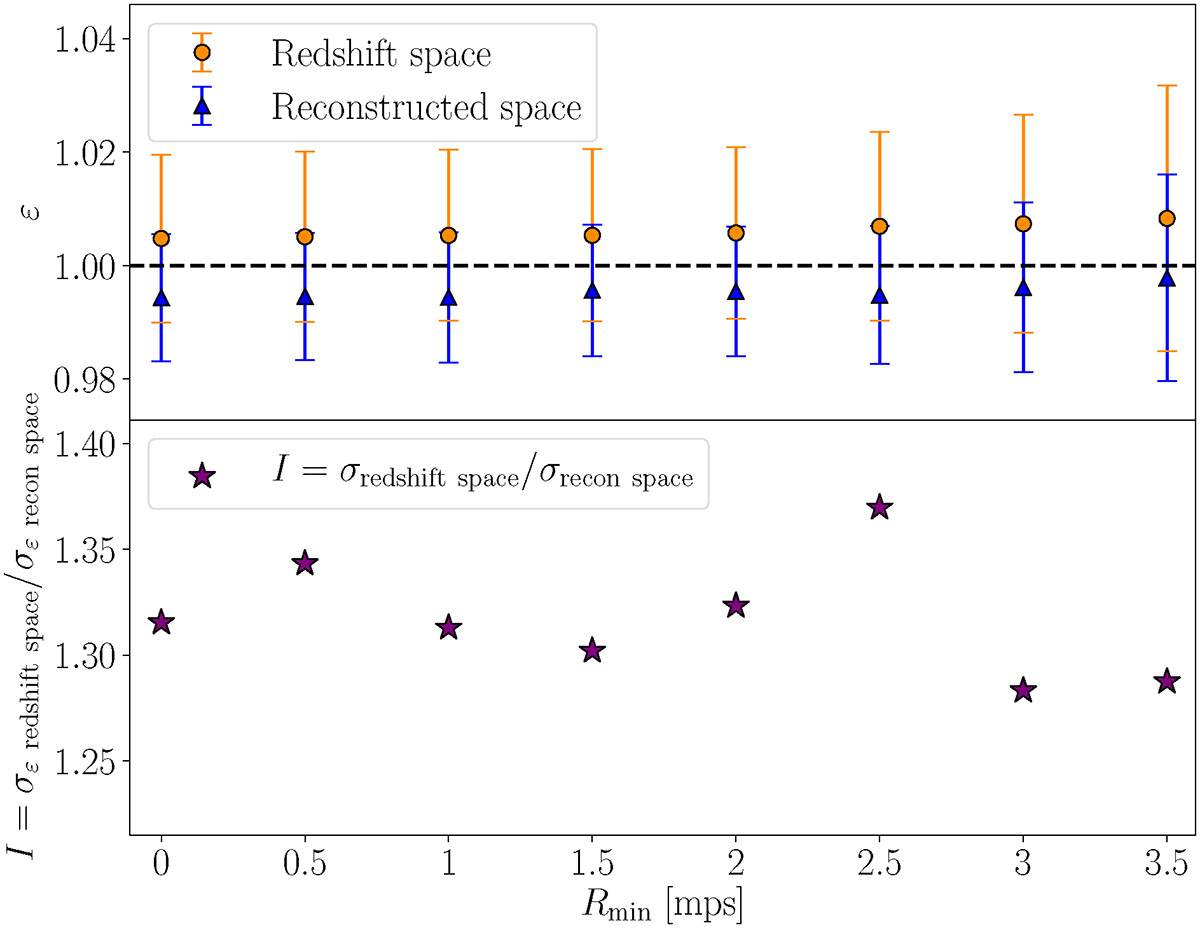
Fig. 5.
Download original image
Top Panel: comparison of the values of the AP parameter ε with its error σε (error bars), obtained with the fitting procedure described in Section 4, for the analysis with tracers and voids in redshift-space (orange dots) and the analysis with tracers and voids in reconstructed space (blue triangles). Each dot represents the ε value as a function of the minimum radius Rmin for the voids in that specific subsample, expressed in mean tracer separation (mps) units, used for computing VGCF. Bottom Panel: improvement factor I, i.e., the ratio between σε estimated in redshift space and reconstructed space.
Current usage metrics show cumulative count of Article Views (full-text article views including HTML views, PDF and ePub downloads, according to the available data) and Abstracts Views on Vision4Press platform.
Data correspond to usage on the plateform after 2015. The current usage metrics is available 48-96 hours after online publication and is updated daily on week days.
Initial download of the metrics may take a while.