Fig. A.2.
Download original image
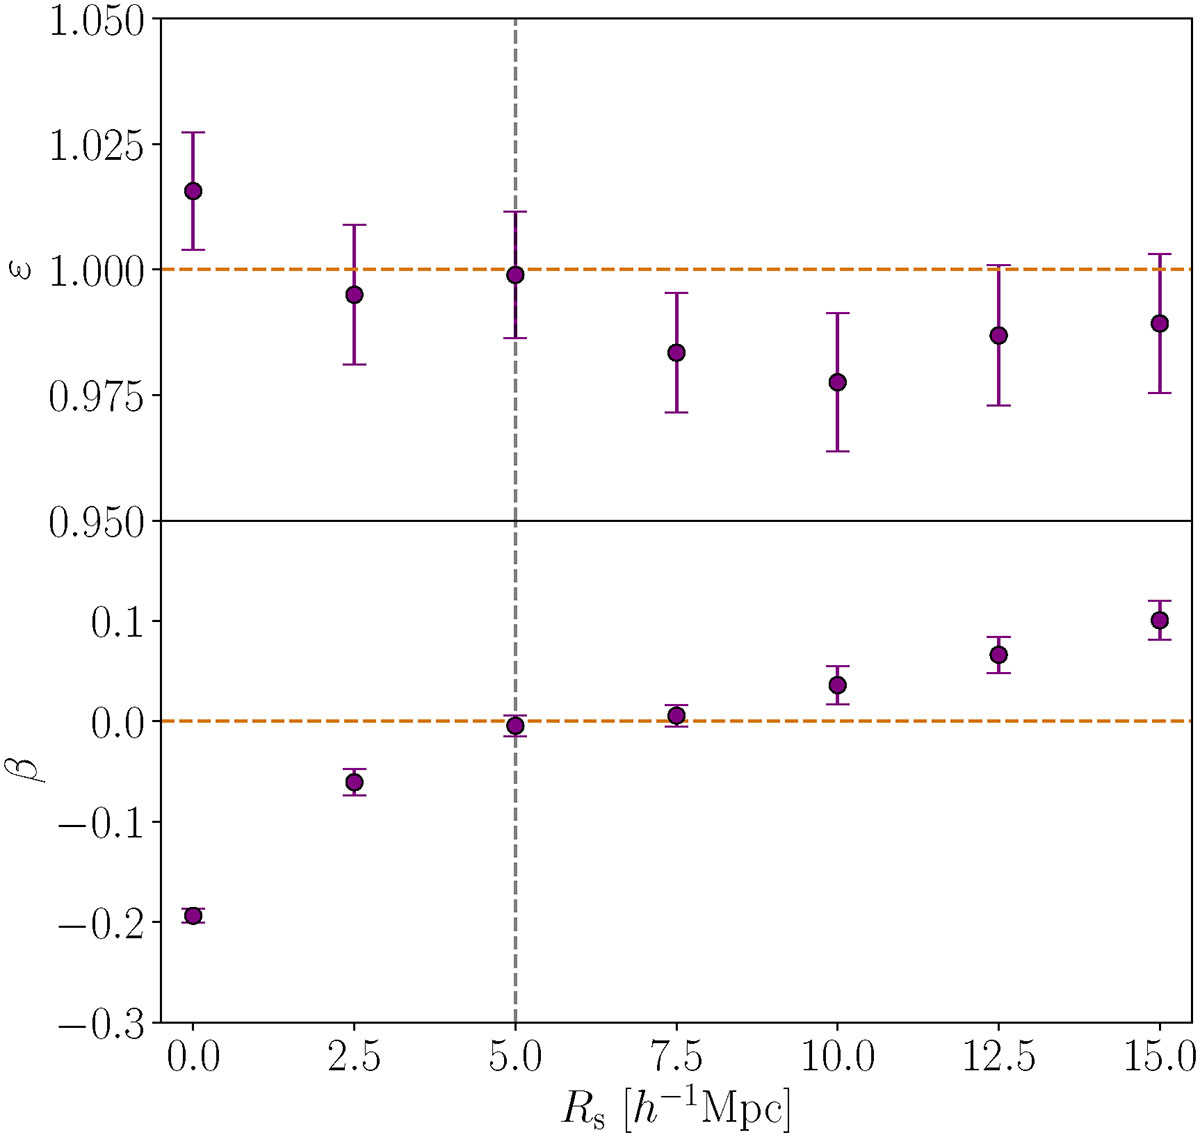
Estimated values of the parameters ε (upper panel) and β (lower panel) for different analyses performed in reconstructed space, each using data reconstructed with a different smoothing scale Rs. The purple dots represent the estimated parameter values for each analysis at a specific Rs, while the black dashed line indicates the expected values, ε = 1 and β = 0.
Current usage metrics show cumulative count of Article Views (full-text article views including HTML views, PDF and ePub downloads, according to the available data) and Abstracts Views on Vision4Press platform.
Data correspond to usage on the plateform after 2015. The current usage metrics is available 48-96 hours after online publication and is updated daily on week days.
Initial download of the metrics may take a while.