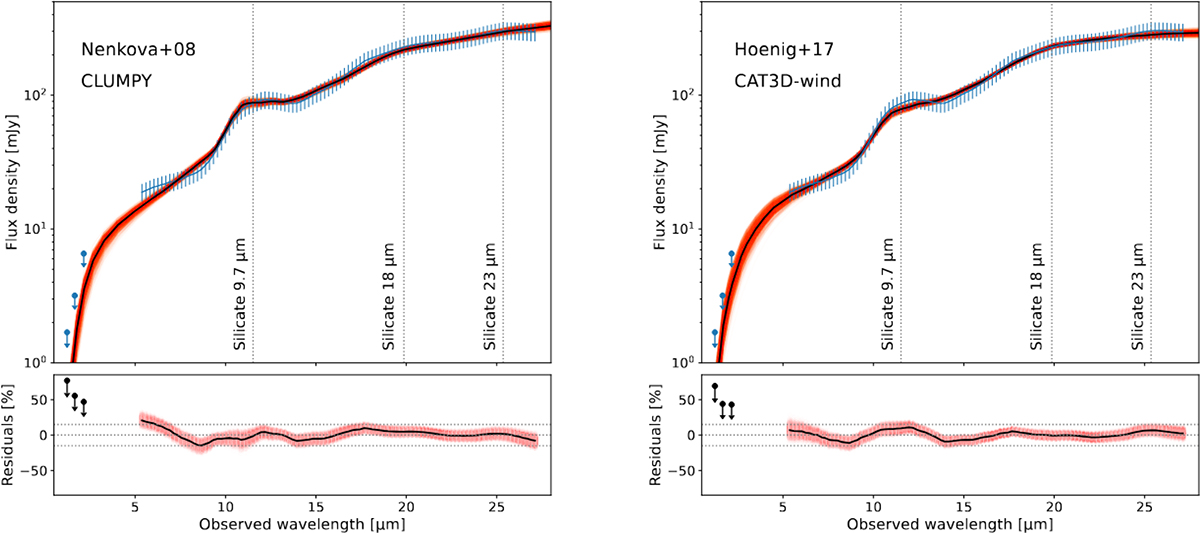
Fig. 2.
Download original image
Smoothed and interpolated nuclear spectrum of J1010, with the emission lines and the PAH features removed (solid blue line), and the best fits the with torus models (shaded orange area, which corresponds to model SEDs between the 16 and 84 percentiles of the posterior and solid black line corresponding to the 50 percentile of the posterior). The left panels correspond to the fit with the clumpy torus models of Nenkova et al. (2008a), and the right panel to the disk + wind models of Hönig & Kishimoto (2017). Vertical dotted lines are the peak wavelengths measured for the silicate features in the nuclear spectrum (see Table 4). The bottom panels show the residuals as a percentage of the continuum flux, with the horizontal dotted lines indicating 0 and 15% error for guidance. The blue and black upper limits are the J, H, and Ks fluxes from the 2MASS Point Source Catalog (1.69, 3.18, and 6.55 mJy, respectively) and corresponding residuals. These upper limits are shown for comparison only and were not included in the fit.
Current usage metrics show cumulative count of Article Views (full-text article views including HTML views, PDF and ePub downloads, according to the available data) and Abstracts Views on Vision4Press platform.
Data correspond to usage on the plateform after 2015. The current usage metrics is available 48-96 hours after online publication and is updated daily on week days.
Initial download of the metrics may take a while.