Open Access
Fig. A.1.
Download original image
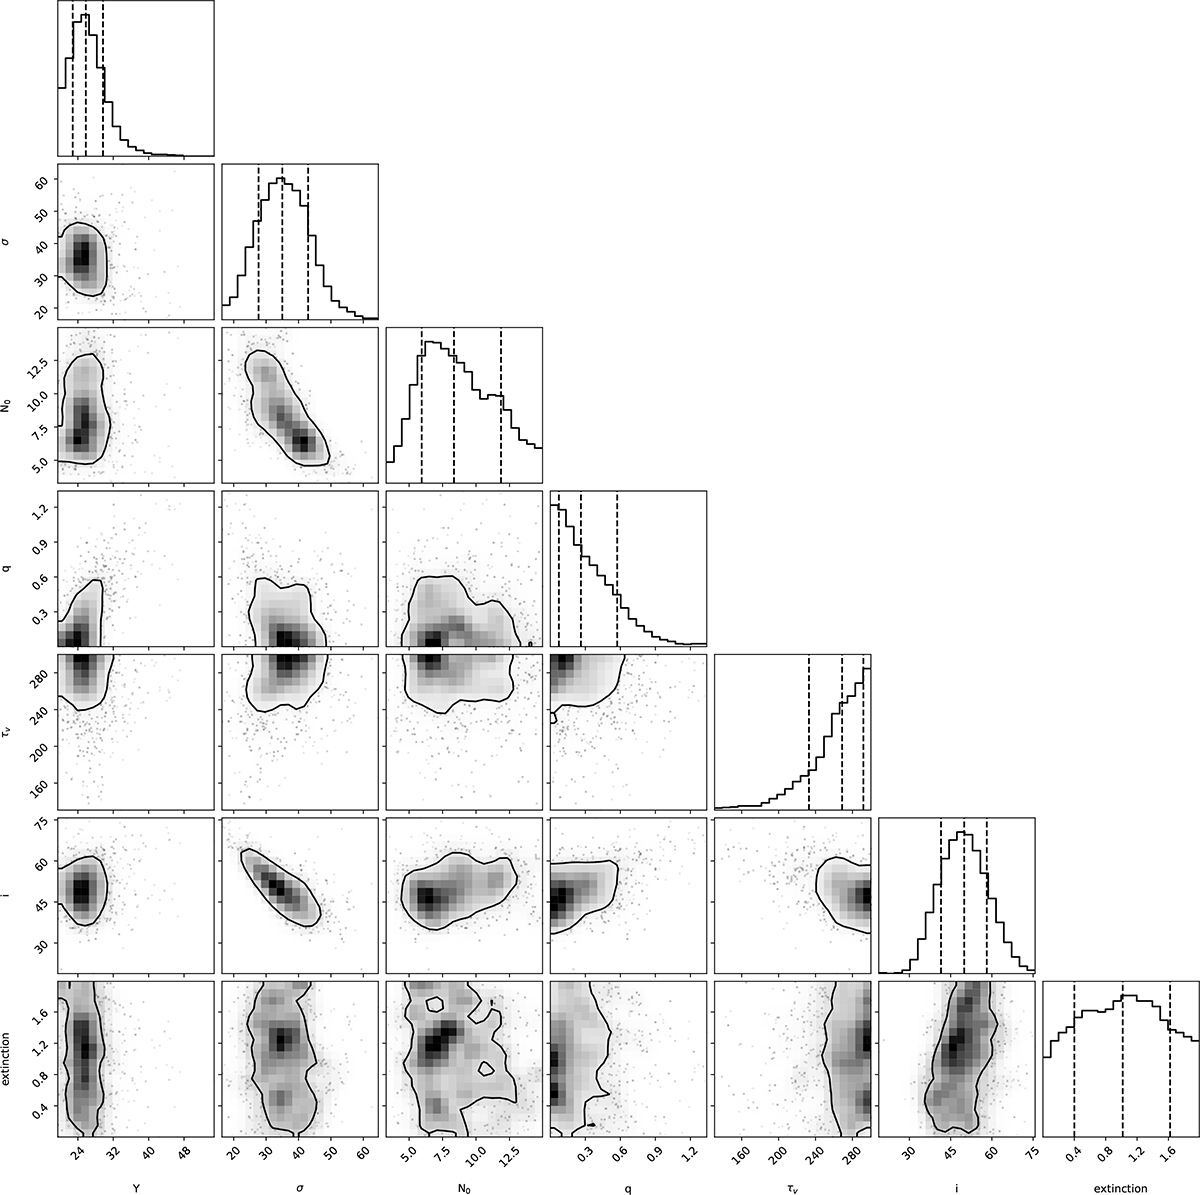
1D and 2D posterior distributions of the model parameters resulting from the fit of J1010 with the clumpy torus model of Nenkova et al. (2008a). The vertical dashed lines correspond to the percentiles at 16, 50, and 84, whose values are reported in Table 2.
Current usage metrics show cumulative count of Article Views (full-text article views including HTML views, PDF and ePub downloads, according to the available data) and Abstracts Views on Vision4Press platform.
Data correspond to usage on the plateform after 2015. The current usage metrics is available 48-96 hours after online publication and is updated daily on week days.
Initial download of the metrics may take a while.