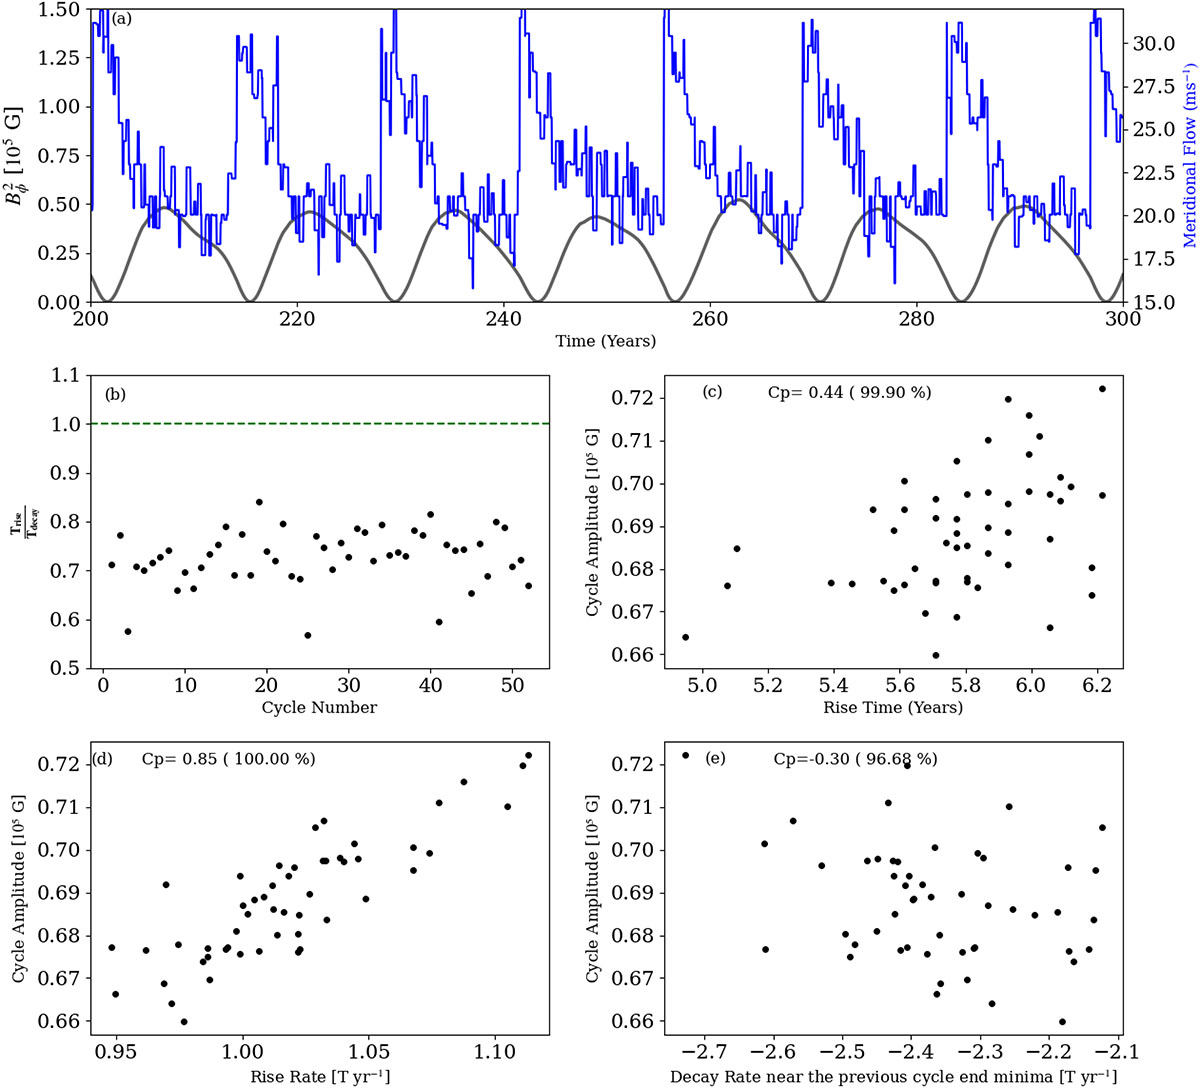
Fig. 10.
Download original image
Impact of meridional flow variations on solar cycle asymmetry. Panel (a): Simulation results where the meridional flow is modulated by the active region eruption belt using the term δvsin2(2θmax), with θmax denoting the latitude of peak toroidal field strength. A random component with a coherence time of three months is superimposed on this modulation to account for convective turbulence, resulting in a hybrid meridional flow profile. The black curve (right y-axis) shows the evolution of magnetic energy density, while the blue curve (left y-axis) shows the variation in the amplitude of the meridional flow. Panels (b)–(e): Asymmetry measures from the same simulation, showing the same quantities as in Fig. 3, with an added 50% stochastic fluctuation in the poloidal field source.
Current usage metrics show cumulative count of Article Views (full-text article views including HTML views, PDF and ePub downloads, according to the available data) and Abstracts Views on Vision4Press platform.
Data correspond to usage on the plateform after 2015. The current usage metrics is available 48-96 hours after online publication and is updated daily on week days.
Initial download of the metrics may take a while.