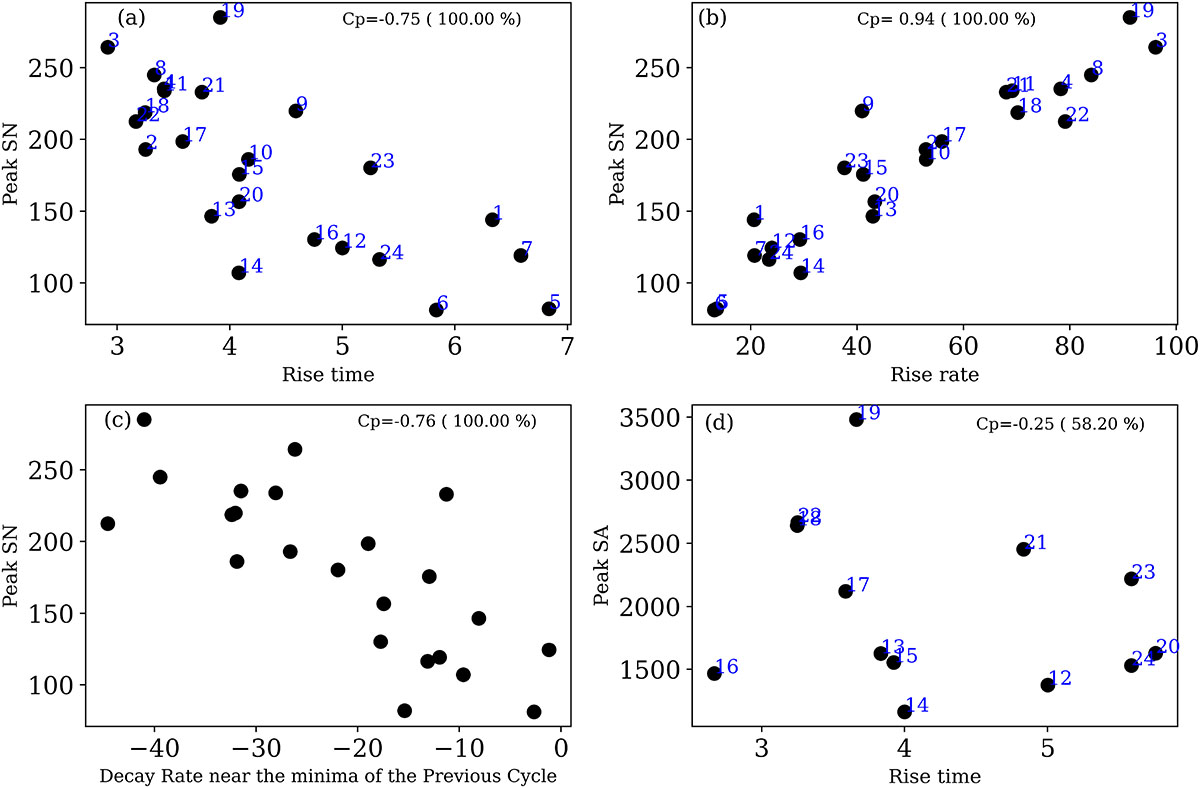
Fig. 2.
Download original image
Observational evidence of solar cycle asymmetry. Panel (a): scatter plots of peak sunspot number versus rise time (in years). Panel (b): scatter plots of peak sunspot number versus rise rate (in units of sunspot number per year). Panel (c): scatter plots of peak sunspot number versus decay rate near the end of the previous cycle minimum (in the same units as the rise rate). Panel (d): scatter plots of peak sunspot area versus rise time (in years). The corresponding cycle numbers are annotated in blue in each scatter plot.
Current usage metrics show cumulative count of Article Views (full-text article views including HTML views, PDF and ePub downloads, according to the available data) and Abstracts Views on Vision4Press platform.
Data correspond to usage on the plateform after 2015. The current usage metrics is available 48-96 hours after online publication and is updated daily on week days.
Initial download of the metrics may take a while.