Fig. 3.
Download original image
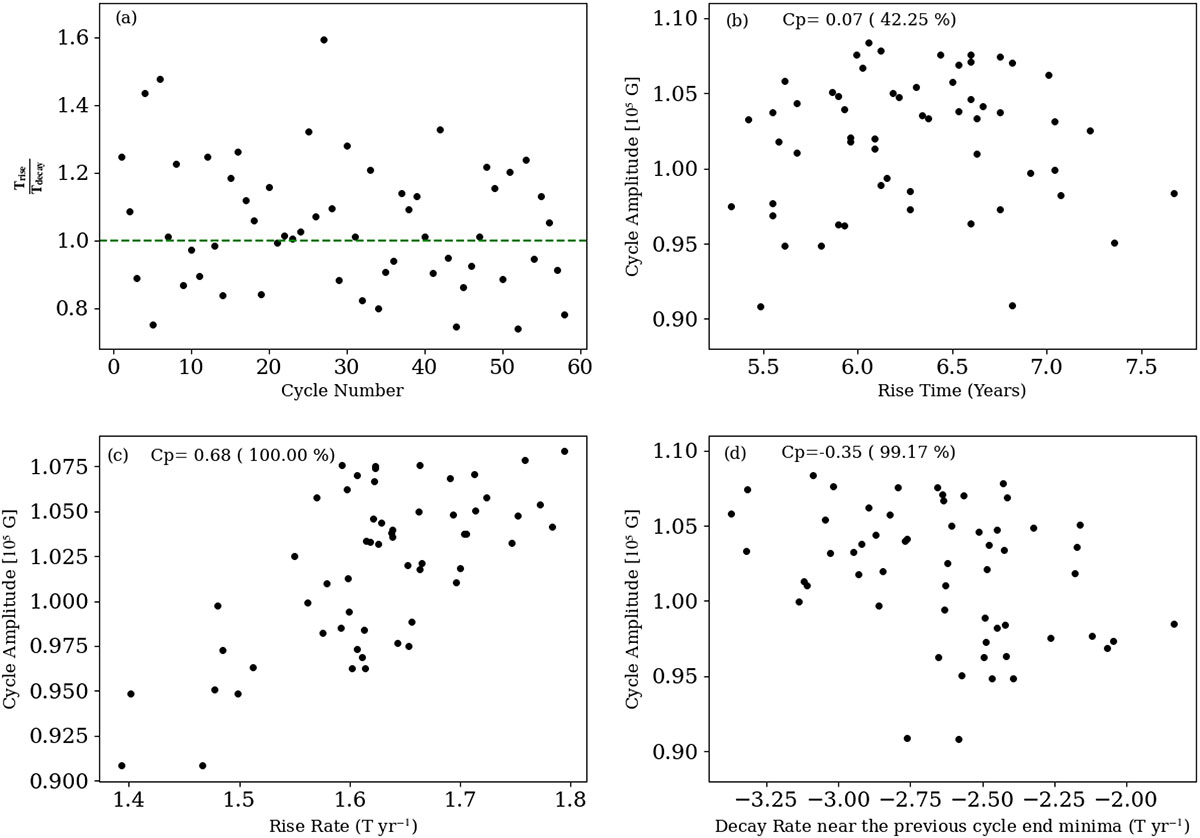
Asymmetries generated from our model by introducing 50% fluctuations in the poloidal field generation mechanism. Panel (a): scatter plot of the rise-to-decay time ratio versus cycle number. Panel (b): scatter plot of cycle amplitude (in Gauss) versus rise time (in years). Panel (c): scatter plot of cycle amplitude versus rise rate (in units of Tesla/year). Panel (d): scatter plot of cycle amplitude versus decay rate near the preceding cycle minimum (in Tesla/year).
Current usage metrics show cumulative count of Article Views (full-text article views including HTML views, PDF and ePub downloads, according to the available data) and Abstracts Views on Vision4Press platform.
Data correspond to usage on the plateform after 2015. The current usage metrics is available 48-96 hours after online publication and is updated daily on week days.
Initial download of the metrics may take a while.