Fig. 4.
Download original image
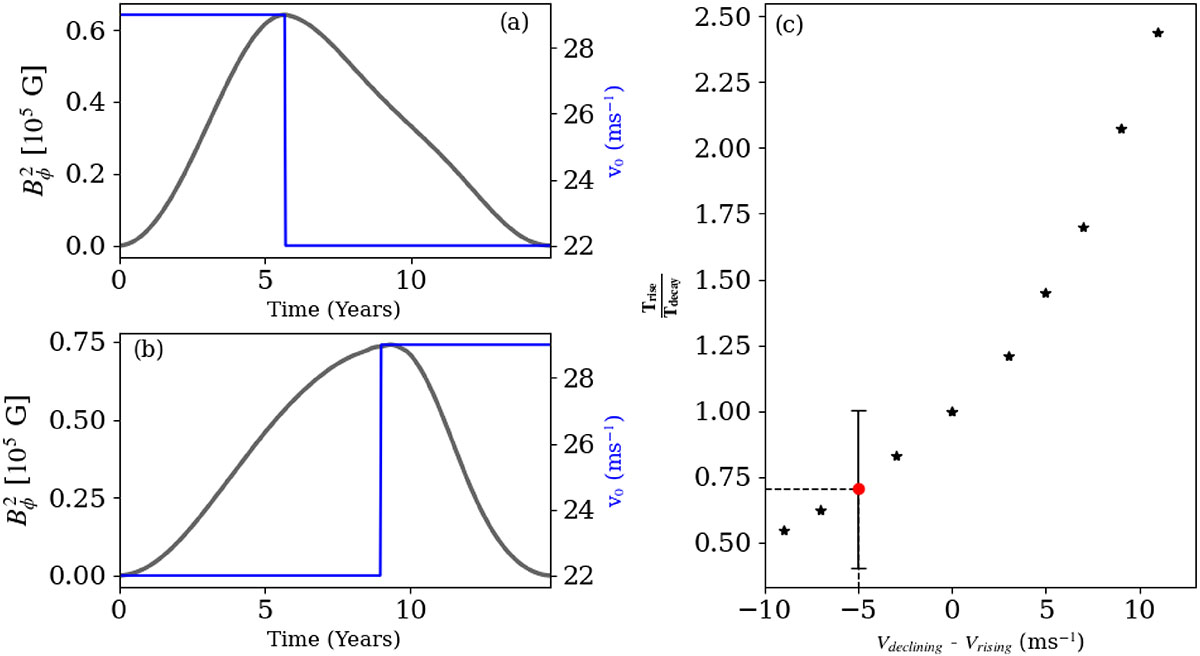
Impact of meridional flow variations on solar cycle asymmetry. Panel (a): temporal evolution of Bϕ2 and meridional flow speed when the flow decreases at the cycle maximum. The black curve (left y-axis) shows the variation of Bϕ2 (a proxy for sunspot number), while the blue curve (right y-axis) shows the meridional flow speed decreasing from a higher to a lower value at the cycle peak. Panel (b): Same as Panel (a), but with the meridional flow increasing from a lower to a higher value at the cycle maximum. Panel (c): variation of the rise-to-decay time ratio as a function of flow asymmetry between the declining and rising phases, expressed as vdeclining − vrising. The red dot corresponds to the mean value of rise-to-decay time ratio.
Current usage metrics show cumulative count of Article Views (full-text article views including HTML views, PDF and ePub downloads, according to the available data) and Abstracts Views on Vision4Press platform.
Data correspond to usage on the plateform after 2015. The current usage metrics is available 48-96 hours after online publication and is updated daily on week days.
Initial download of the metrics may take a while.