Fig. 8.
Download original image
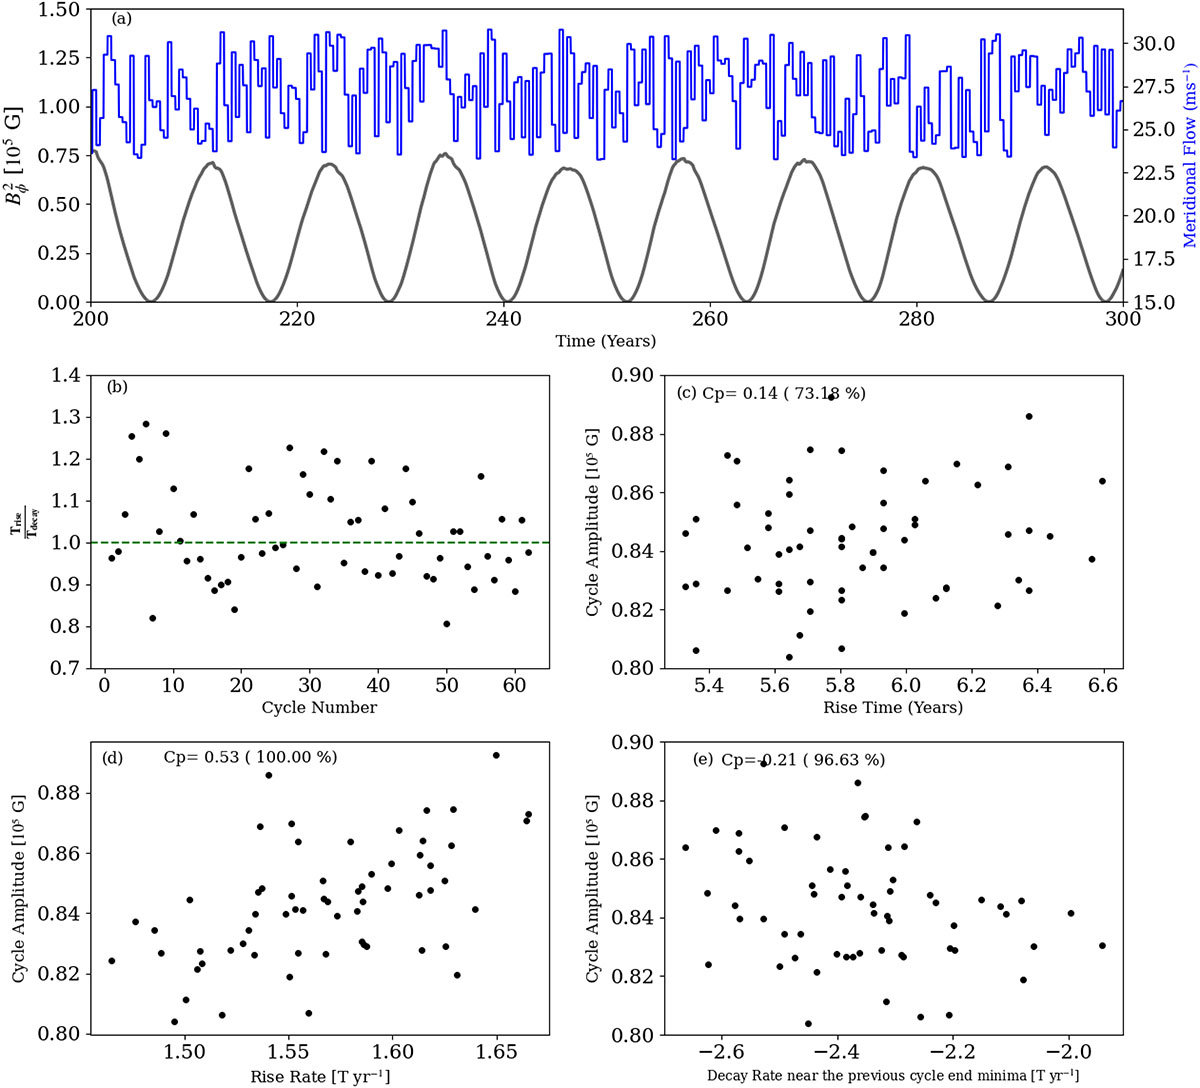
Impact of meridional flow variations on solar cycle asymmetry. Panel (a): Results when the meridional flow varies randomly with a coherence time of one month. The black curve (right y-axis) shows the magnetic energy density evolution, while the blue curve (left y-axis) shows the amplitude variation of the meridional flow. Panels (b)–(e): Asymmetry measures derived from the same simulation. These four panels represent the same quantities as in Fig. 3. We have also included an additional 50% stochastic fluctuation in the poloidal field generation mechanism.
Current usage metrics show cumulative count of Article Views (full-text article views including HTML views, PDF and ePub downloads, according to the available data) and Abstracts Views on Vision4Press platform.
Data correspond to usage on the plateform after 2015. The current usage metrics is available 48-96 hours after online publication and is updated daily on week days.
Initial download of the metrics may take a while.