Fig. 2.
Download original image
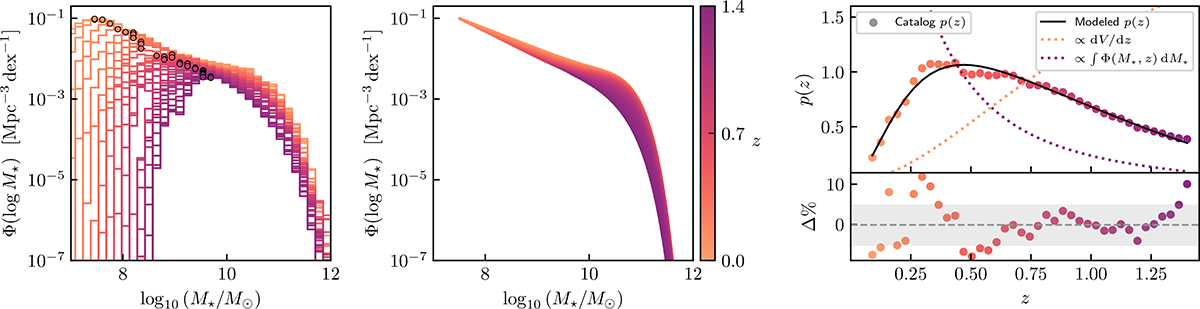
Stellar mass and redshift distribution of the parent galaxy catalog. Left panel: Stellar mass function in different redshift bins measured from the original MICECATv2 galaxy catalog. The points indicate the peak number density at each redshift bin. Central panel: Theoretical stellar mass function modeled as a double Schechter function evolving in redshift. Right panel: Redshift distribution of the parent galaxy catalog. The black line shows the theoretical distribution obtained from the product of the cosmological volume element dominating at low-z (dotted orange line) and the integral of the Schechter damping the distribution at high-z (dotted purple line). The bottom panel shows the percentage difference, highlighting the median (gray line) and the 16–84 percentile range (gray band).
Current usage metrics show cumulative count of Article Views (full-text article views including HTML views, PDF and ePub downloads, according to the available data) and Abstracts Views on Vision4Press platform.
Data correspond to usage on the plateform after 2015. The current usage metrics is available 48-96 hours after online publication and is updated daily on week days.
Initial download of the metrics may take a while.