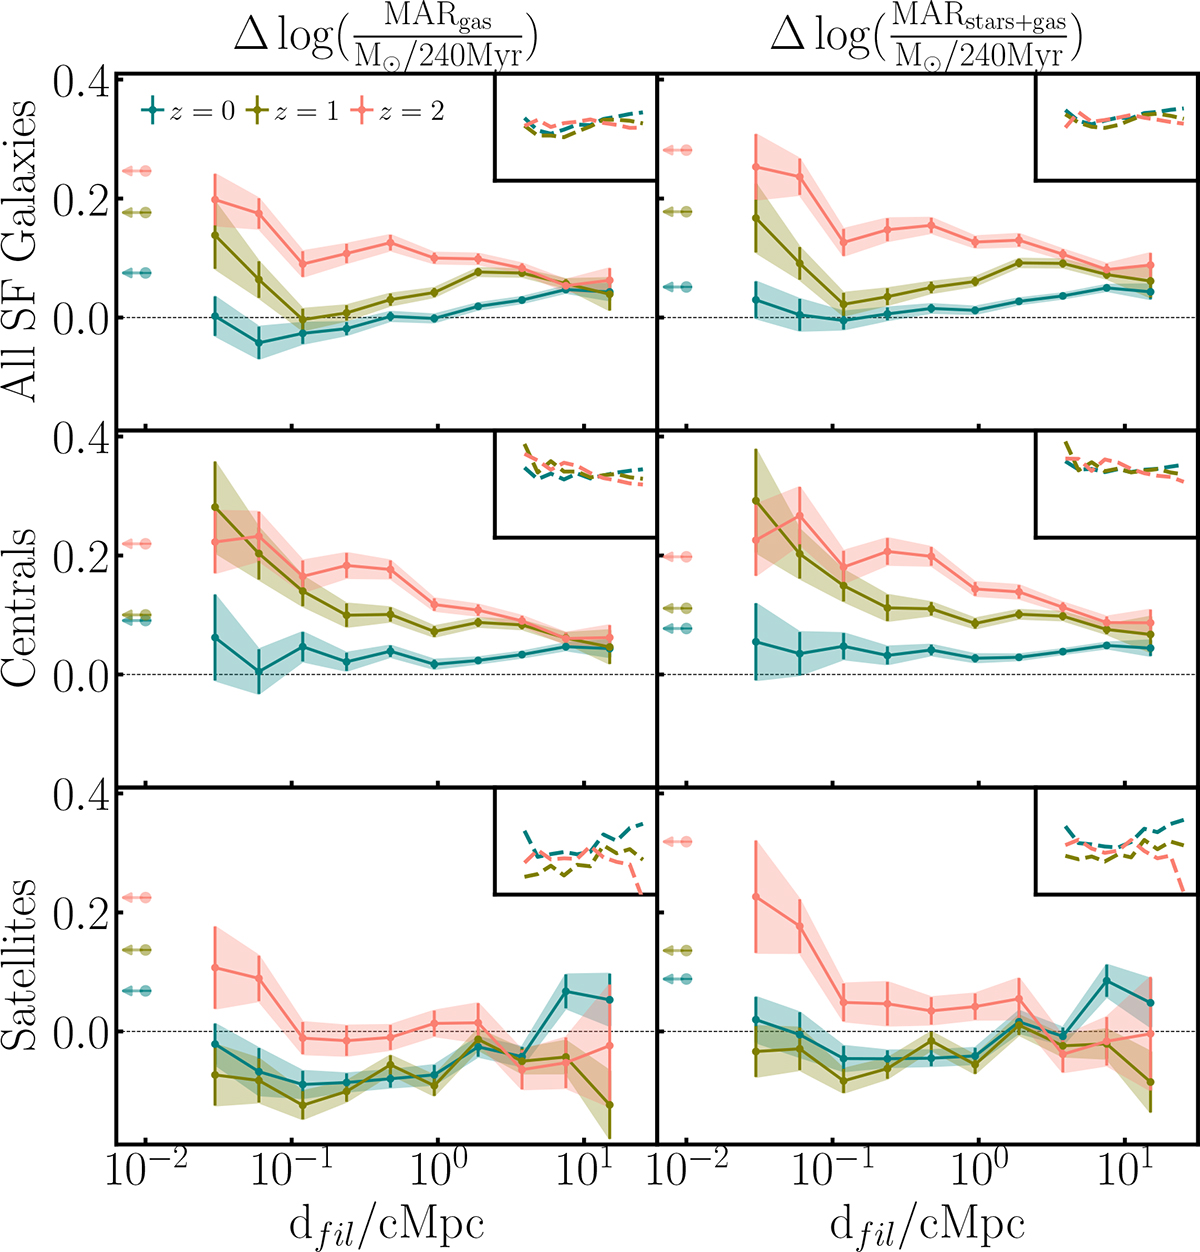
Fig. 10.
Download original image
Deviation of the gas mass accretion rate (left panel) and baryonic mass accretion rate (right panel) from the respective best-fit relations in logarithmic scale as a function of the distance to the closest filament for star-forming galaxies in SIMBA in bins of distance at z = 0 (blue), 1 (green), and 2 (red) for, from top to bottom, all star-forming galaxies, only central star-forming galaxies, and only satellite star-forming galaxies. The arrows pointing to the left give the value for a bin containing all the galaxies not included in the distance range we study here. For each quantity, the upper right box shows the deviation of the in-bin median from the best-fit relation. Gas and baryonic accretion rates closely track sSFR trends, with a dip at intermediate distances and a recovery in filament cores, especially at z ≤ 1.
Current usage metrics show cumulative count of Article Views (full-text article views including HTML views, PDF and ePub downloads, according to the available data) and Abstracts Views on Vision4Press platform.
Data correspond to usage on the plateform after 2015. The current usage metrics is available 48-96 hours after online publication and is updated daily on week days.
Initial download of the metrics may take a while.