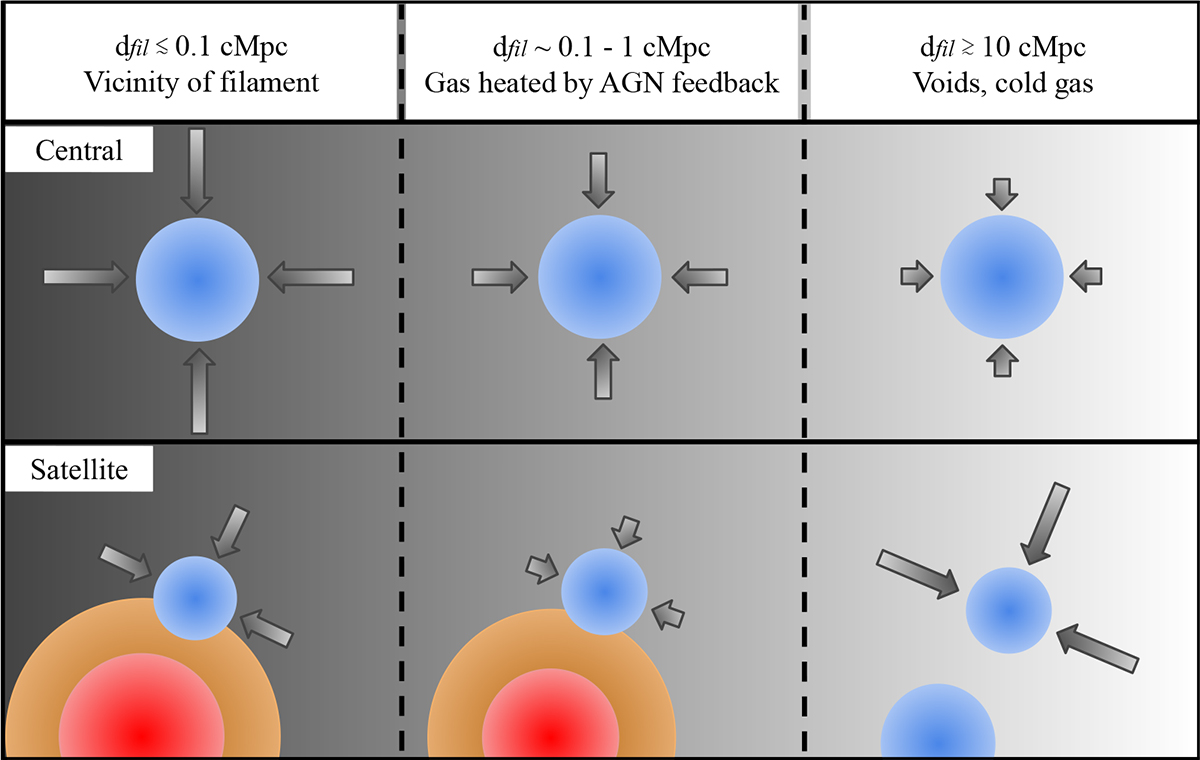
Fig. 13.
Download original image
Schematic view of our multi-scale scenarios of gas accretion for central galaxies (upper panel) and satellite galaxies (lower panel) for different typical distances to the filaments from the filaments (left column) to the voids (right columns). The grey arrows give a qualitative representation of the accretion to the star-forming galaxy in blue. For dfil ≲ 1 cMpc, the quenched central galaxy of the satellite is represented in red, with the associated hot CGM in orange. For dfil ≳ 10 cMpc, most satellites have star-forming central, thus the central galaxy is also in blue. Centrals retain cold gas near filaments, while satellites experience preprocessing and stripping before partial gas re-accretion near filament cores.
Current usage metrics show cumulative count of Article Views (full-text article views including HTML views, PDF and ePub downloads, according to the available data) and Abstracts Views on Vision4Press platform.
Data correspond to usage on the plateform after 2015. The current usage metrics is available 48-96 hours after online publication and is updated daily on week days.
Initial download of the metrics may take a while.