Fig. B.1.
Download original image
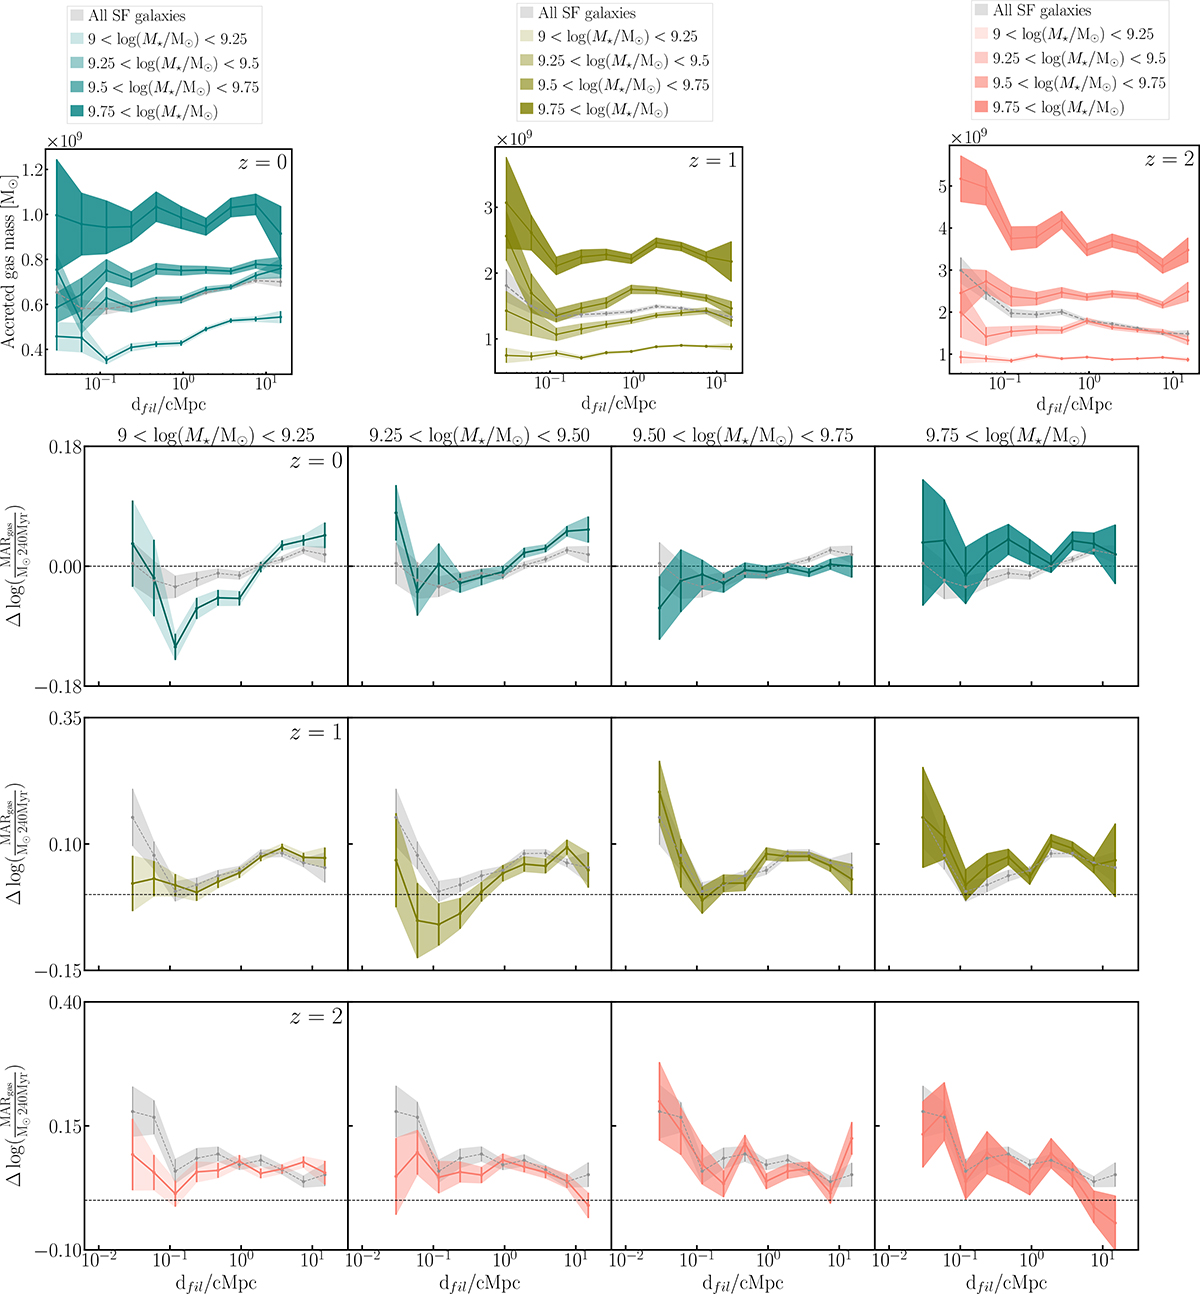
Mean accreted gas mass between two SIMBA snapshots at z = 0 (blue), z = 1 (green), and z = 2 (red) shown in the top panels as a function of distance to the filaments within different mass bins for star-forming galaxies. The other panels show the residuals in mass accretion rate for galaxies within mass bins, from the lowest masses (left) to the highest masses (right), compared with the residuals for the entire star forming population (in grey, see Sect. 4.5) with the same colours for the same redshifts. All bins at all redshifts show trends consistent with the one found for the entire star forming population, but the 9.5 < log(M★/M⊙) < 9.75 bin at z = 0 is noteworthy as the residuals decrease at low distances, a behaviour not found anywhere else.
Current usage metrics show cumulative count of Article Views (full-text article views including HTML views, PDF and ePub downloads, according to the available data) and Abstracts Views on Vision4Press platform.
Data correspond to usage on the plateform after 2015. The current usage metrics is available 48-96 hours after online publication and is updated daily on week days.
Initial download of the metrics may take a while.