Fig. C.1.
Download original image
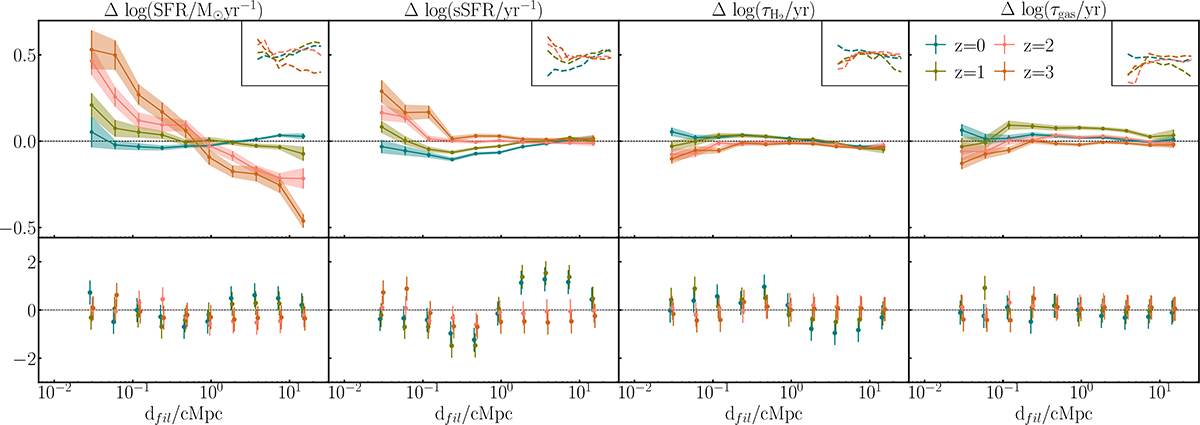
Deviation of the mean star-formation rate, specific star-formation rate, molecular hydrogen depletion time, and gas depletion timescale (top panel, from left to right) from the respective best-fit relations in logarithmic scale as a function of the distance to the closest filament for star-forming galaxies in SIMBA in bins of distance at z = 0 (blue), 1 (green), 2 (red), and 3 (brown) with the exclusions of galaxies with halo mass Mh > 1013 M⊙. The arrows pointing to the left give the value for a bin containing all the galaxies not included in the distance range we study here. For each quantity, the upper right box shows the deviation of the in-bin median from the best-fit relation. Lower panel: standardised deviation of the same quantities between the values obtained in Fig. 3 and the upper panel. Overall, the results do not deviate significantly from those in Fig. 3.
Current usage metrics show cumulative count of Article Views (full-text article views including HTML views, PDF and ePub downloads, according to the available data) and Abstracts Views on Vision4Press platform.
Data correspond to usage on the plateform after 2015. The current usage metrics is available 48-96 hours after online publication and is updated daily on week days.
Initial download of the metrics may take a while.