Fig. 2.
Download original image
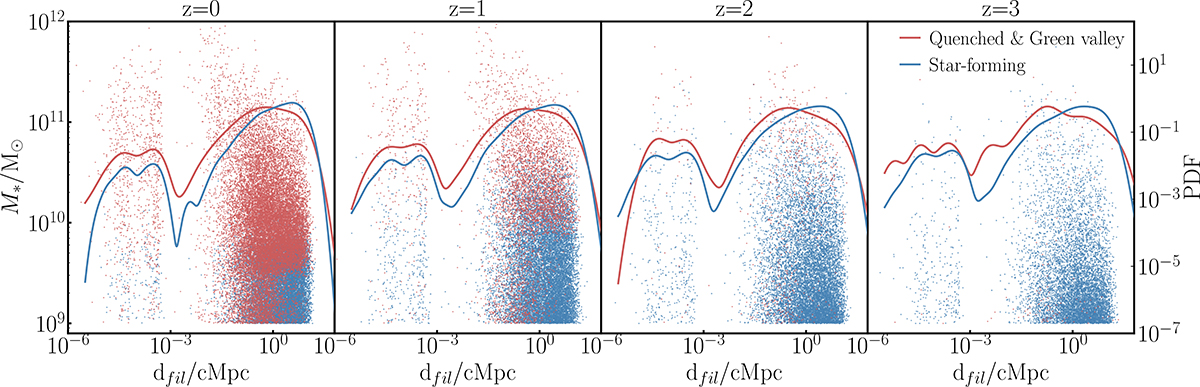
Stellar mass of star-forming galaxies (blue) and quenched and green-valley galaxies (red) in SIMBA at z = 0, 1, and 2 (from left to right) as a function of the distance to the closest filament. Each dot represents a galaxy position in the stellar mass-dfil parameter space (left side y-axis), and the solid lines are the corresponding smoothed and normalised distributions of distances for each population (right side y-axis). The visual inspection reveals the emergence of quenching at z ∼ 1 and only a marginal quenched galaxy population a z ≥ 2, with massive quenched galaxies lying typically closer to filaments than star-forming galaxies at all redshifts with a significant quenched population at z = 0.
Current usage metrics show cumulative count of Article Views (full-text article views including HTML views, PDF and ePub downloads, according to the available data) and Abstracts Views on Vision4Press platform.
Data correspond to usage on the plateform after 2015. The current usage metrics is available 48-96 hours after online publication and is updated daily on week days.
Initial download of the metrics may take a while.