Fig. 6.
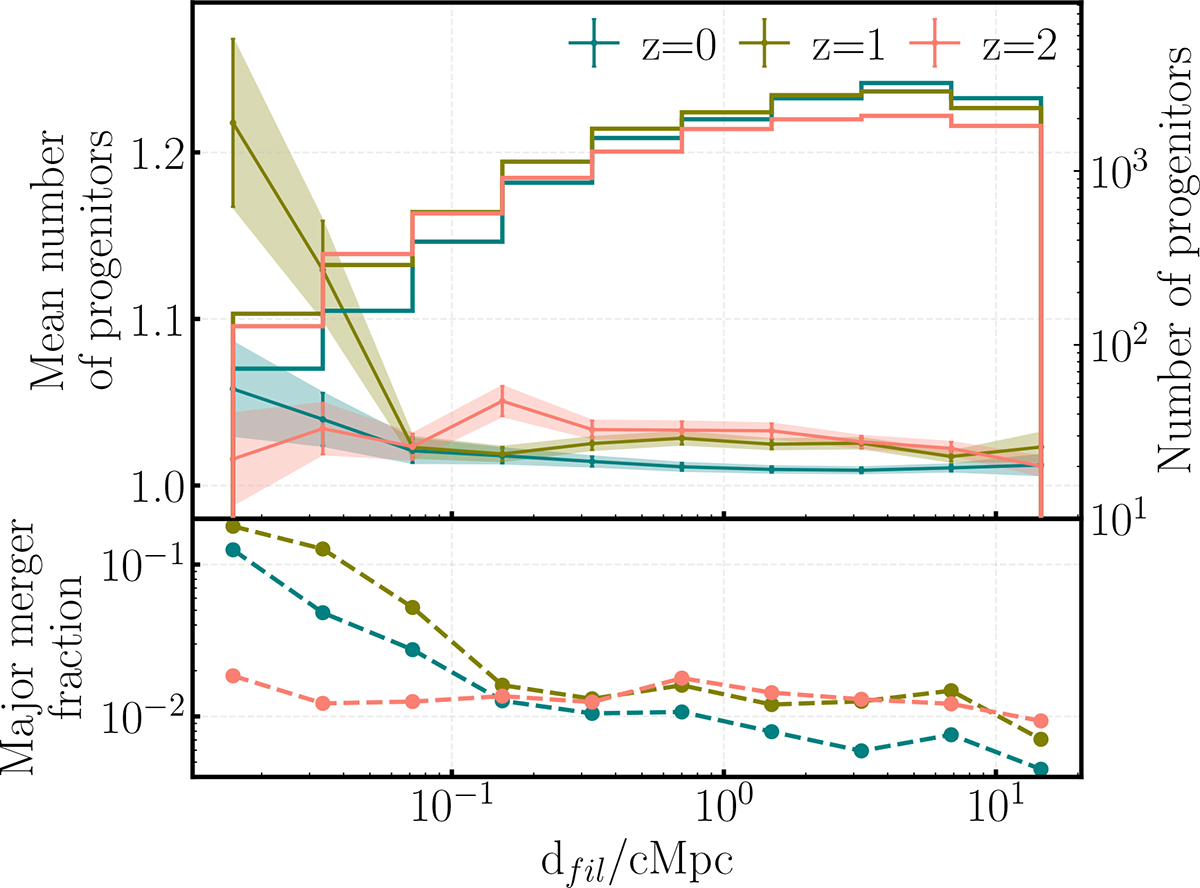
Download original image
Top: Mean number of progenitors per galaxy and distribution of the number of progenitors as a function of the distance to the closest filament at z = 0, 1 (green), and 2 (red). Bottom: Fraction of major mergers, defined as galaxies with secondary progenitors with a stellar-mass ratio of at least 1:4, for the three redshifts as a function of the distance to the closest filament. The frequency of recent mergers increases near filaments at low redshift, but major mergers remain rare and are unlikely to dominate environmental trends.
Current usage metrics show cumulative count of Article Views (full-text article views including HTML views, PDF and ePub downloads, according to the available data) and Abstracts Views on Vision4Press platform.
Data correspond to usage on the plateform after 2015. The current usage metrics is available 48-96 hours after online publication and is updated daily on week days.
Initial download of the metrics may take a while.