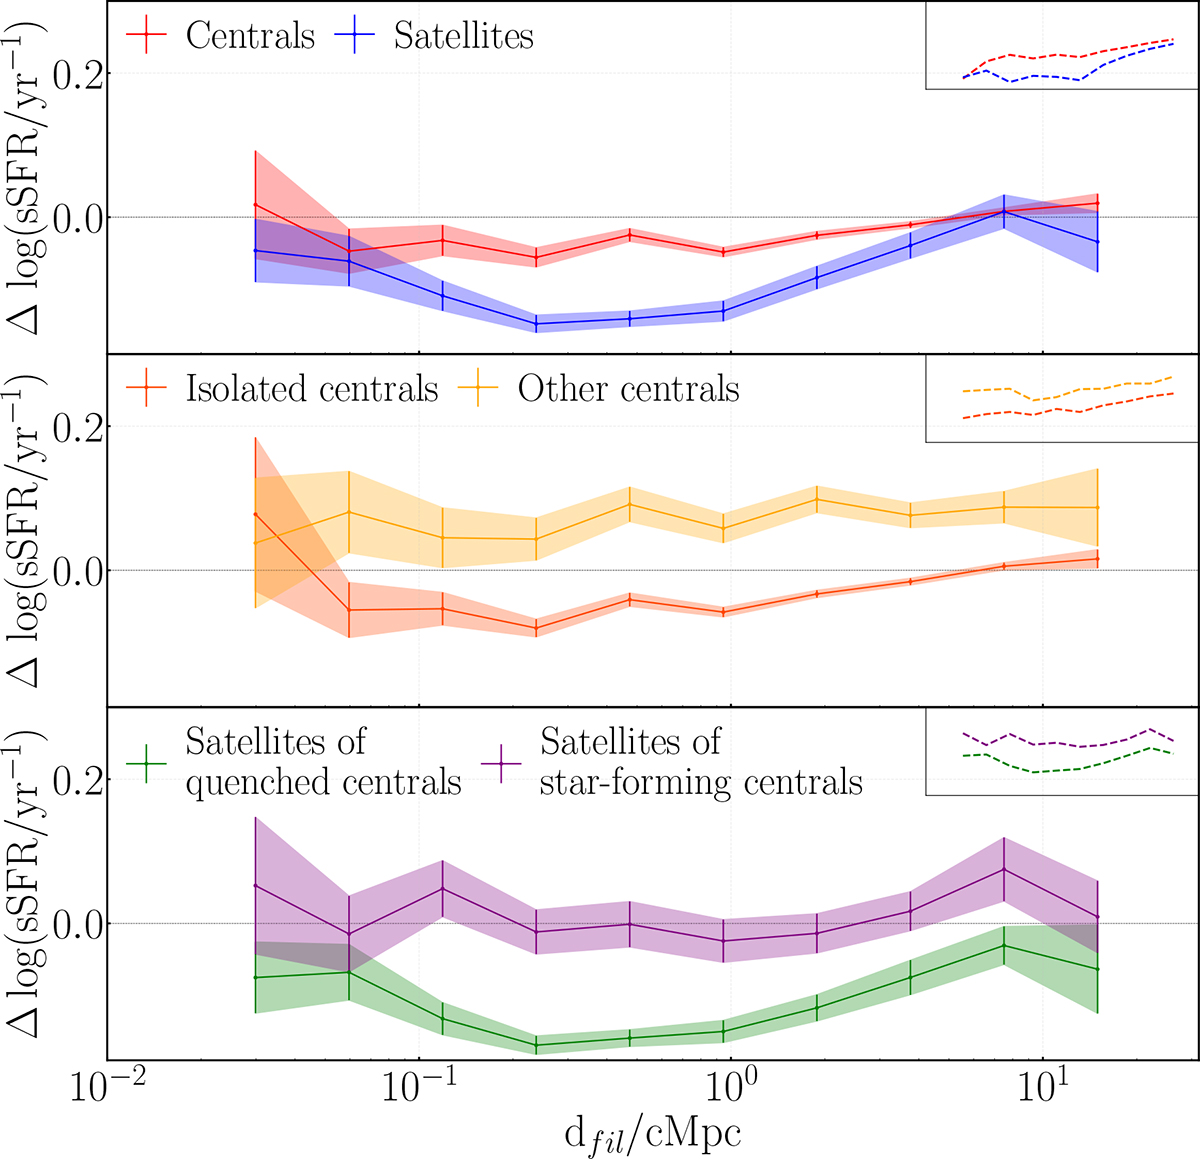
Fig. 8.
Download original image
Deviation of the mean specific star-formation rate for central and satellite galaxies (red, blue: top panel), field and cluster central galaxies (orange-red, orange: middle panel), and satellite of quenched central and star-forming central galaxies (green, purple: bottom panel) from the best-fit relation in logarithmic scale as a function of the distance to the closest filament for star-forming galaxies in SIMBA in bins of distance at z = 0. For each panel, the upper right box shows the deviations of the in-bin medians from the best-fit relation. The V-shaped sSFR–filament distance trend at z = 0 is driven primarily by satellites, particularly those orbiting quenched centrals.
Current usage metrics show cumulative count of Article Views (full-text article views including HTML views, PDF and ePub downloads, according to the available data) and Abstracts Views on Vision4Press platform.
Data correspond to usage on the plateform after 2015. The current usage metrics is available 48-96 hours after online publication and is updated daily on week days.
Initial download of the metrics may take a while.