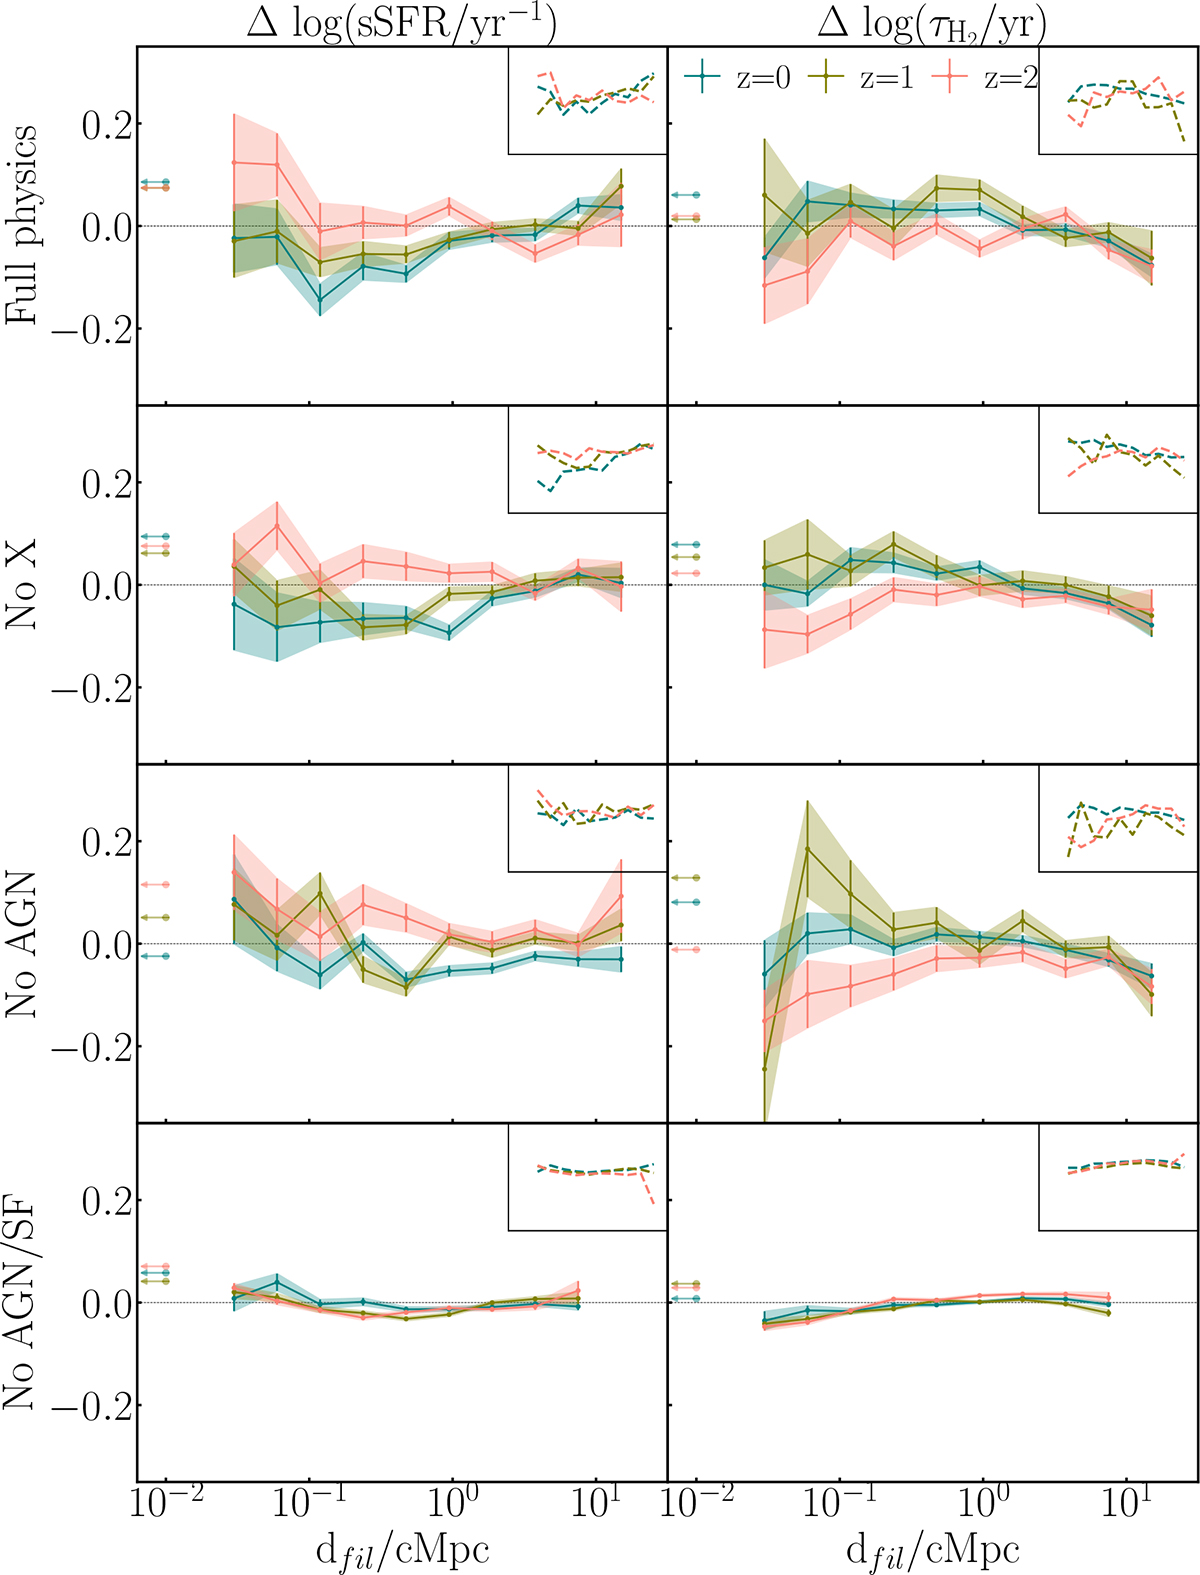
Fig. 9.
Download original image
Deviation of the mean specific star-formation rate (top) and molecular hydrogen depletion timescale (bottom) from the respective best-fit relations in logarithmic scale as a function of dfil in SIMBA in bins of distance at z = 0 (blue), 1 (green), and 2 (red). The arrows pointing to the left give the value for a bin containing all the galaxies not included in the distance range we study here. For each quantity, the upper right box shows the deviation of the in-bin median from the best-fit relation. From left to right, the columns give the results for the full physics, no X-ray feedback, no AGN feedback, and no AGN and stellar feedback in the 50 cMpc3 runs. Removing stellar feedback processes flattens sSFR–distance trends.
Current usage metrics show cumulative count of Article Views (full-text article views including HTML views, PDF and ePub downloads, according to the available data) and Abstracts Views on Vision4Press platform.
Data correspond to usage on the plateform after 2015. The current usage metrics is available 48-96 hours after online publication and is updated daily on week days.
Initial download of the metrics may take a while.