Fig. 1
Download original image
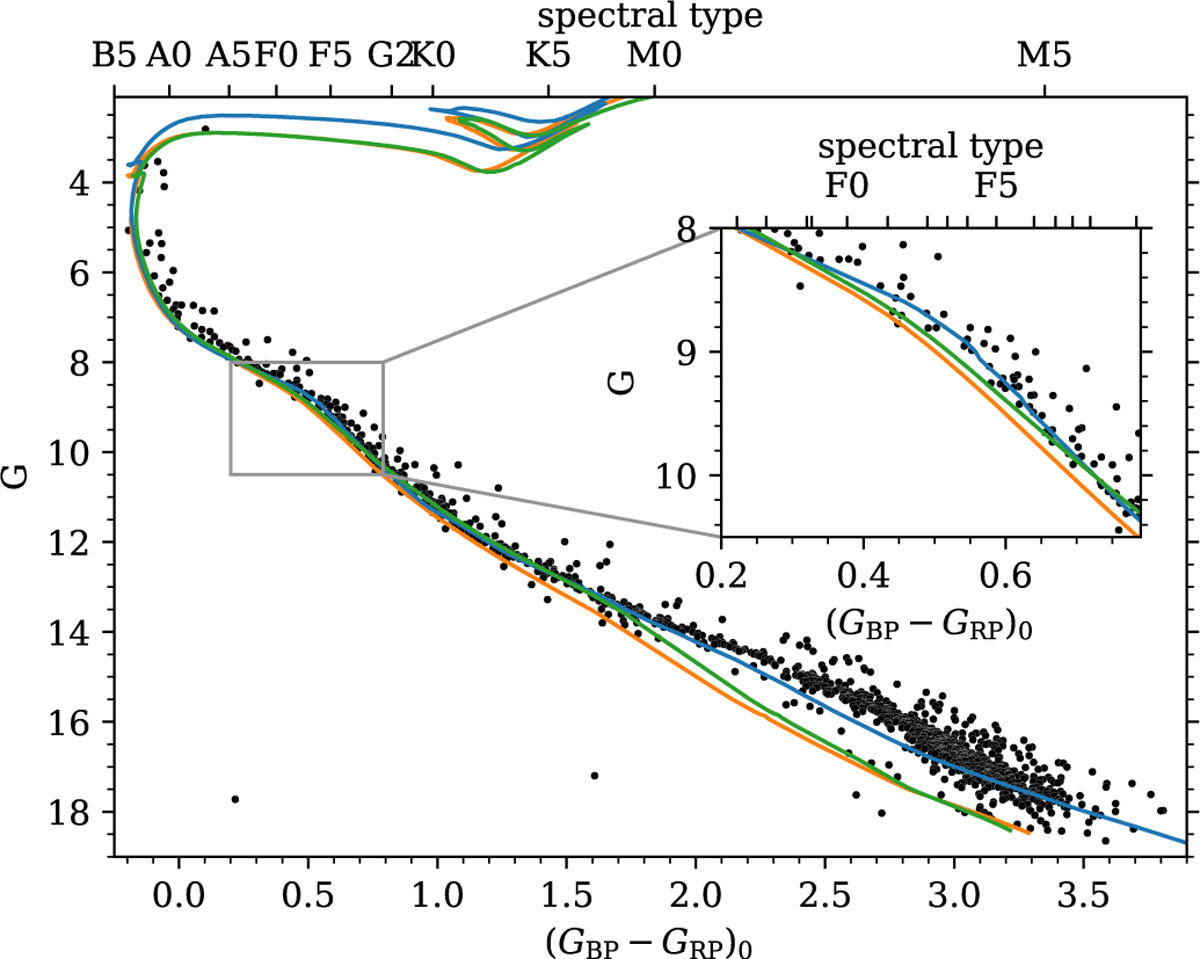
Colour–magnitude diagram of the Pleiades overlaid with rotating isochrones at 125 Myr. In orange we show MIST (Dotter 2016; Choi et al. 2016) and in blue we show PARSEC (Nguyen et al. 2022). The green isochrone is the MIST model with the YBC bolometric corrections (Chen et al. 2019). The inset highlights the bump around spectral type F. The top axis indicates the spectral type.
Current usage metrics show cumulative count of Article Views (full-text article views including HTML views, PDF and ePub downloads, according to the available data) and Abstracts Views on Vision4Press platform.
Data correspond to usage on the plateform after 2015. The current usage metrics is available 48-96 hours after online publication and is updated daily on week days.
Initial download of the metrics may take a while.