Fig. 2
Download original image
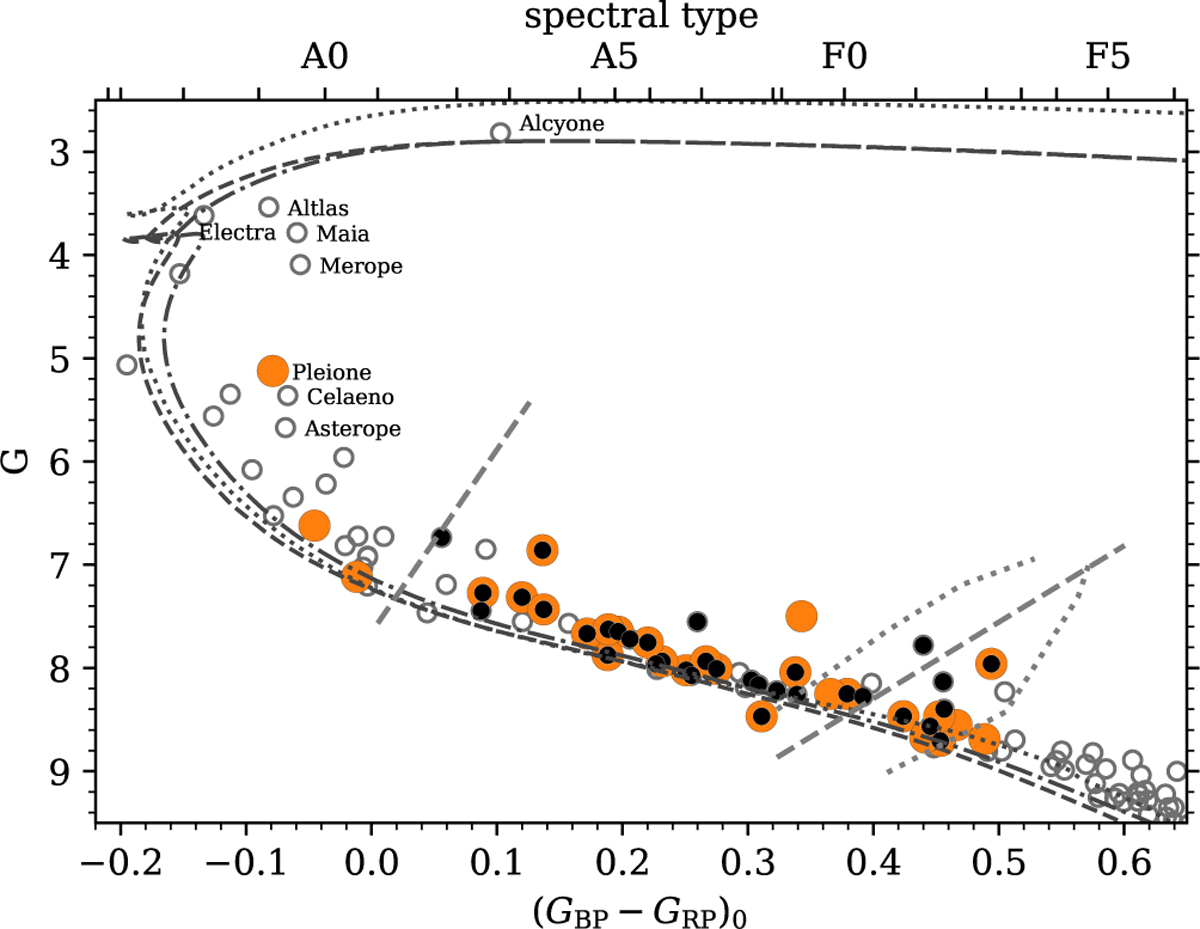
Colour-magnitude diagram of the upper main sequence of the Pleiades. We mark our discovered g-mode pulsators with orange and known p-mode pulsators from Bedding et al. (2023) with black dots. The dotted and dashed lines crossing the cluster sequence indicate the γ Dor and δ Sct instability strips, respectively (Dupret et al. 2004; Murphy et al. 2019). The grey lines show the isochrones from Fig. 1 with MIST dashed, PARSEC dotted, and MIST with the YBC bolometric corrections adopted in PARSEC dash-dotted. Stars with proper names are labelled.
Current usage metrics show cumulative count of Article Views (full-text article views including HTML views, PDF and ePub downloads, according to the available data) and Abstracts Views on Vision4Press platform.
Data correspond to usage on the plateform after 2015. The current usage metrics is available 48-96 hours after online publication and is updated daily on week days.
Initial download of the metrics may take a while.