Fig. 5
Download original image
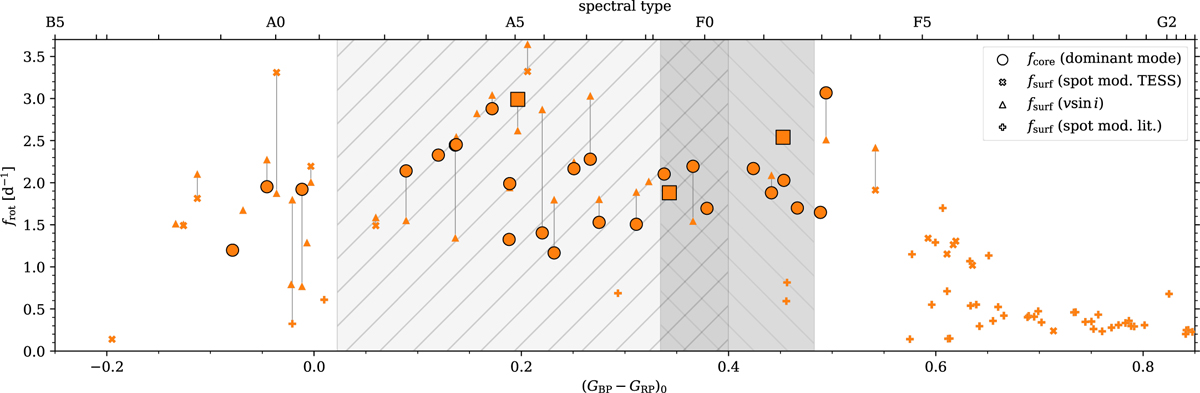
Stellar rotation rates for upper main-sequence stars in the Pleiades. Asteroseismic near-core rotation rates are shown with large symbols, while surface rotation rates are shown with small symbols. The different shapes correspond to the different methods. Squares indicate near-core rotation inferred from period spacing patterns using the traditional approximation of rotation, while circles are based on the dominant mode frequency of the g-mode pulsators. Photometric surface rotation rates are marked with plusses for stars from Rebull et al. (2016a) and with crosses for new detection in this work. Finally, we show rotation rates estimated from v sin i measurements in the Pleiades with triangles. Stars with both surface and near-core rotation rates are connected by lines. The hatched grey areas indicate the approximate range of the theoretical γ Dor (downwards left-to-right, Dupret et al. 2004) and observational δ Sct (upwards left-to-right, Murphy et al. 2019) instability strips. The asteroseismic uncertainties are mostly within the symbol sizes and have been omitted for clarity.
Current usage metrics show cumulative count of Article Views (full-text article views including HTML views, PDF and ePub downloads, according to the available data) and Abstracts Views on Vision4Press platform.
Data correspond to usage on the plateform after 2015. The current usage metrics is available 48-96 hours after online publication and is updated daily on week days.
Initial download of the metrics may take a while.