Fig. 5
Download original image
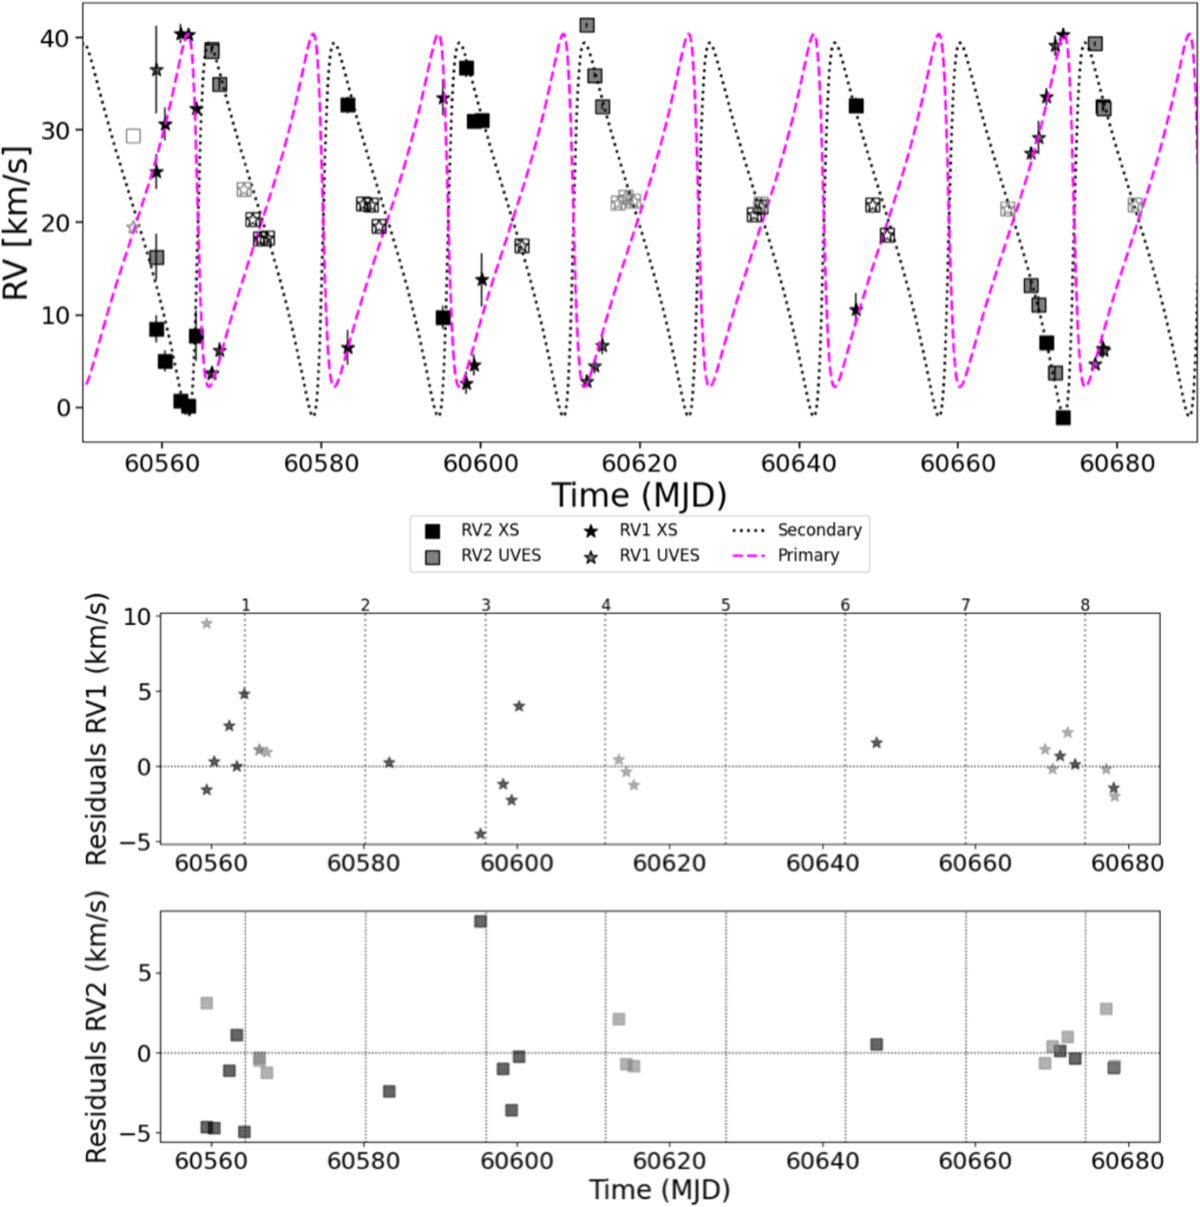
Orbital solution for DQ Tau across multiple orbits. The magenta and black lines fit the primary and secondary data taken with X-shooter and UVES, respectively. The RVs shown in open symbols are discarded from the fitting procedure. Below is the residual plot. The number of DQ Tau orbital cycles is marked in vertical dashed grey lines.
Current usage metrics show cumulative count of Article Views (full-text article views including HTML views, PDF and ePub downloads, according to the available data) and Abstracts Views on Vision4Press platform.
Data correspond to usage on the plateform after 2015. The current usage metrics is available 48-96 hours after online publication and is updated daily on week days.
Initial download of the metrics may take a while.