Fig. 1
Download original image
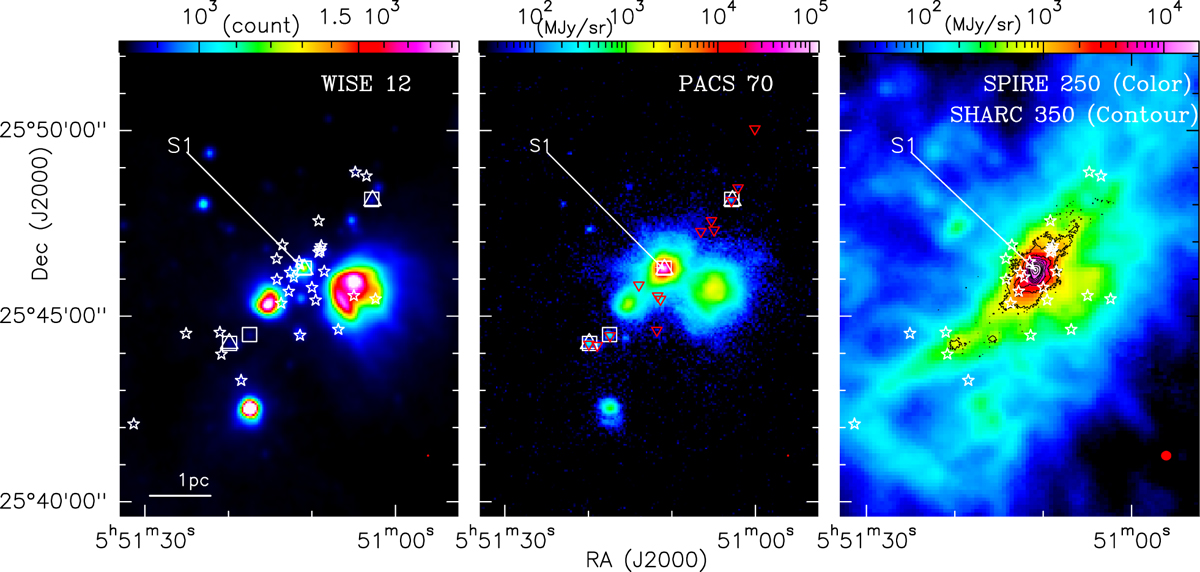
Continuum images of the G183 region. Left: WISE 12 μm. Middle: Herschel/PACS at 70 μm. Right: 250 μm SPIRE image (colour) with 350 μm SHARC image with a beam size of ![]() as contours. Contour levels (Jy/beam) are 0.5, 2, 4, 6, 8, 10, 12 to 30 in steps of 8. Continuum sources at 70 and 160 μm shown as white open squares and triangles, respectively. Class 1 and Class 2 sources from GLIMPSE360 are shown as inverted red triangles and white asterisks. The location of the massive YSO S1 is also marked for reference.
as contours. Contour levels (Jy/beam) are 0.5, 2, 4, 6, 8, 10, 12 to 30 in steps of 8. Continuum sources at 70 and 160 μm shown as white open squares and triangles, respectively. Class 1 and Class 2 sources from GLIMPSE360 are shown as inverted red triangles and white asterisks. The location of the massive YSO S1 is also marked for reference.
Current usage metrics show cumulative count of Article Views (full-text article views including HTML views, PDF and ePub downloads, according to the available data) and Abstracts Views on Vision4Press platform.
Data correspond to usage on the plateform after 2015. The current usage metrics is available 48-96 hours after online publication and is updated daily on week days.
Initial download of the metrics may take a while.