Open Access
Fig. 10
Download original image
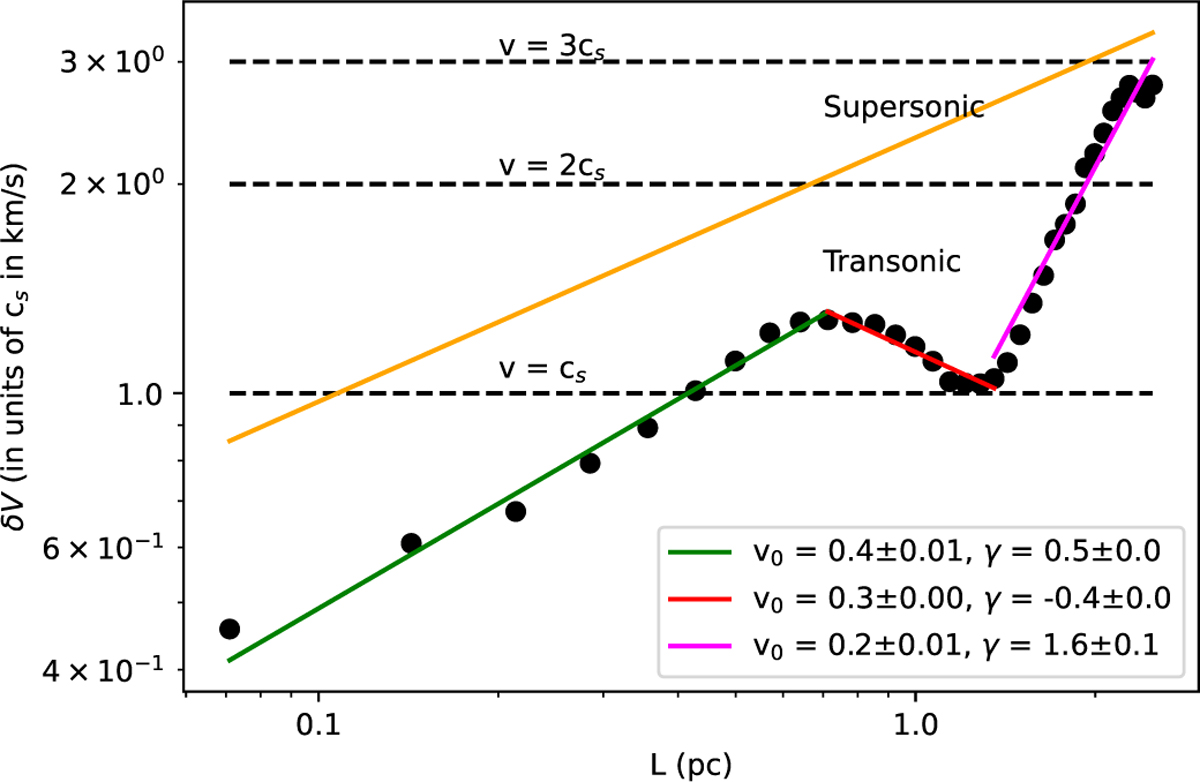
Plot of average velocity dispersion, δV =< |v(r) − v(r + L)|2 >1/2 = v0Lγ, in units of sound speed cs at 20 K (0.27 km s−1) along the main filament starting from the south. The straight yellow line corresponds to the Larson’s law with v0 = 0.63 and γ = 0.38 (Larson 1981).
Current usage metrics show cumulative count of Article Views (full-text article views including HTML views, PDF and ePub downloads, according to the available data) and Abstracts Views on Vision4Press platform.
Data correspond to usage on the plateform after 2015. The current usage metrics is available 48-96 hours after online publication and is updated daily on week days.
Initial download of the metrics may take a while.