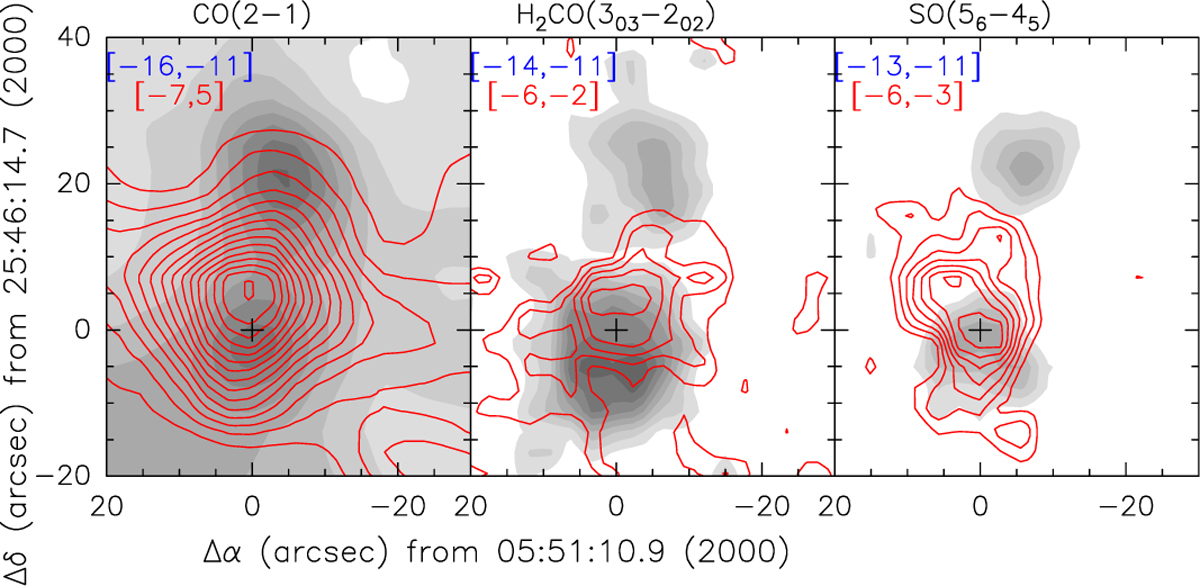
Fig. 11
Download original image
Distribution of the blue (greyscale) and red lobes (contours) of outflowing gas as detected in some of the transitions. The ‘+’ marks the position of the massive YSO. Contour levels are in K km s−1. For CO(2–1) blue contours are at 10–45 in steps of 5 and red contours are at 15 to 85 in steps of 5. For H2CO(3–2) blue contours are at 0.3 to 1.0 in steps of 0.1 and red contours are at 0.3–0.7 in steps of 0.1. For SO(56–54) blue contours are at 0.3–0.1 in steps of 0.1 and red contours are at 0.3–1.4 in steps of 0.1. In all panels the velocity ranges used for integration for the blue and red lobes are marked.
Current usage metrics show cumulative count of Article Views (full-text article views including HTML views, PDF and ePub downloads, according to the available data) and Abstracts Views on Vision4Press platform.
Data correspond to usage on the plateform after 2015. The current usage metrics is available 48-96 hours after online publication and is updated daily on week days.
Initial download of the metrics may take a while.