Fig. 12
Download original image
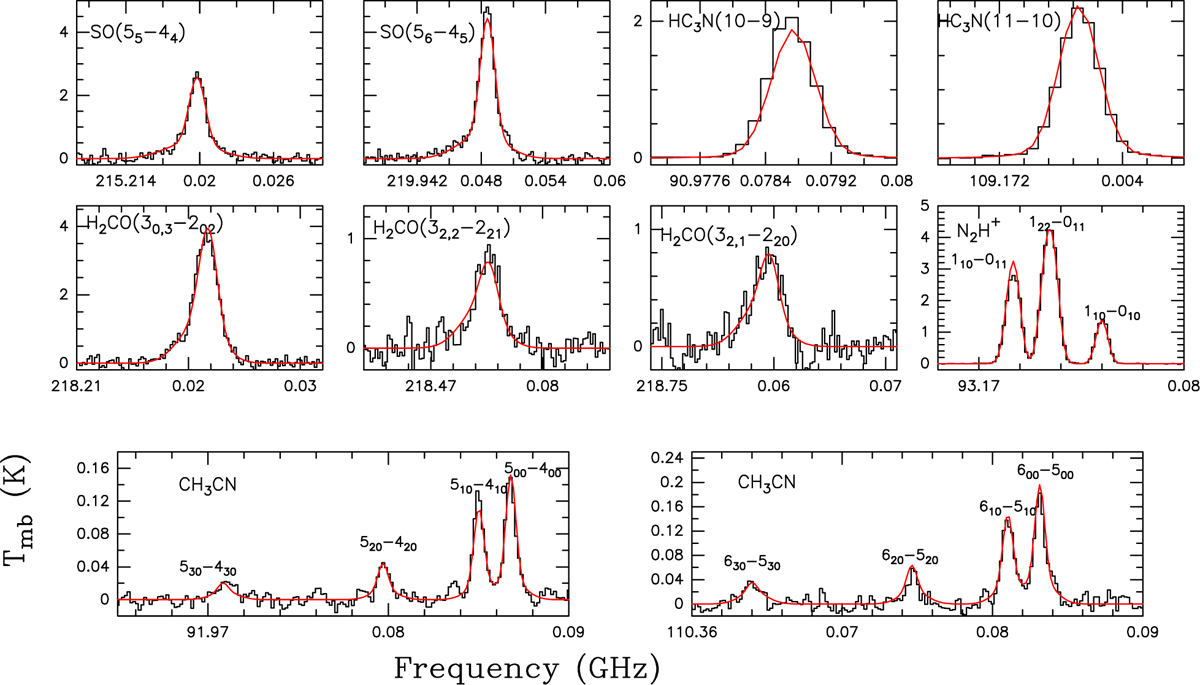
Results of LTE-modeling of spectra for selected transitions of CH3CN, H2CO, HC3N and SO at S1. The black histograms show the observed spectra and the red continuous lines correspond to the spectra predicted by the best fit model. All transitions of a particular species have been fitted simultaneously using CASSIS as is mentioned in the text. The reduced χ2 values for the model fits are 1.68 (CH3CN), 0.95 (H2CO), 0.95 (HC3N), 0.87 (SO), 1.02 (N2H+).
Current usage metrics show cumulative count of Article Views (full-text article views including HTML views, PDF and ePub downloads, according to the available data) and Abstracts Views on Vision4Press platform.
Data correspond to usage on the plateform after 2015. The current usage metrics is available 48-96 hours after online publication and is updated daily on week days.
Initial download of the metrics may take a while.