Fig. 2
Download original image
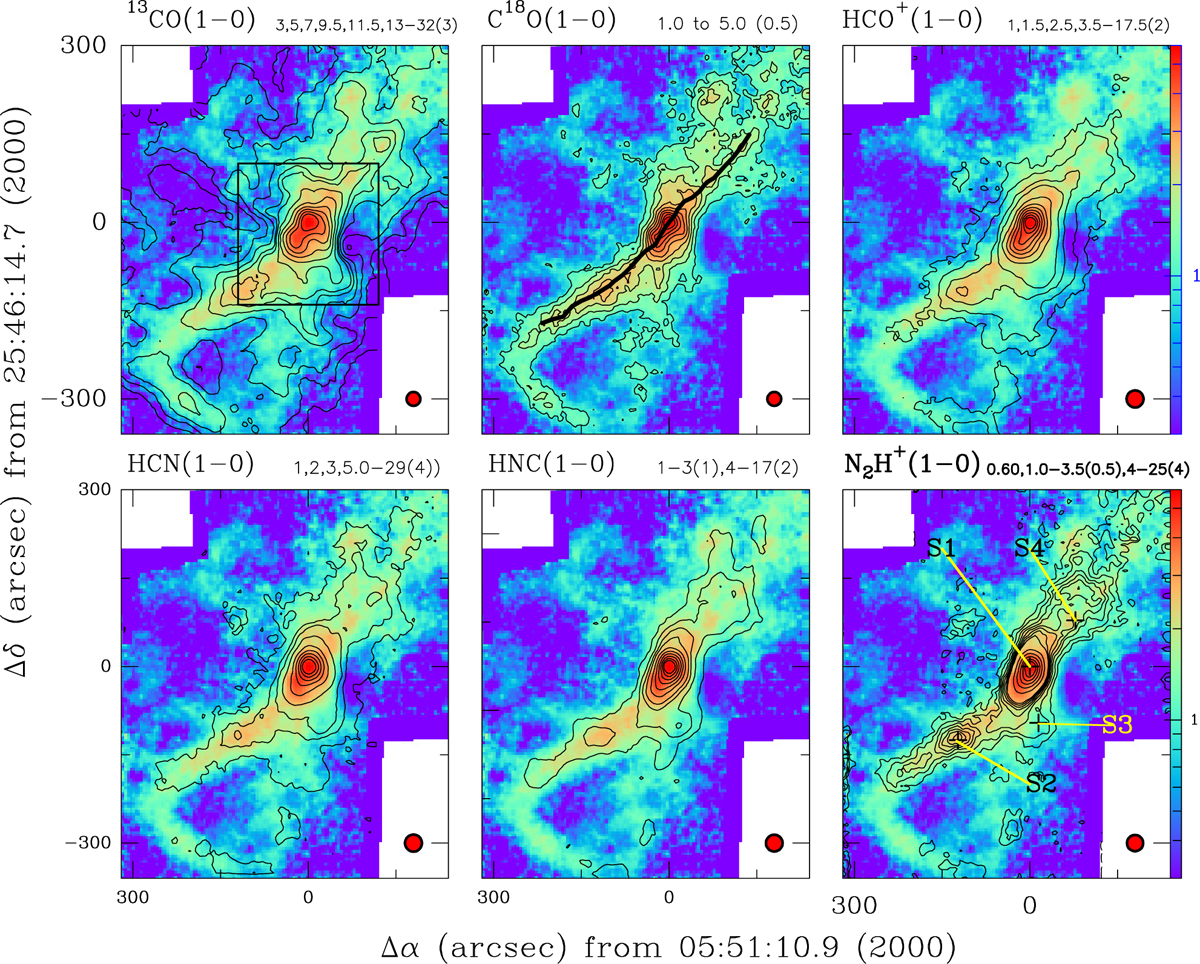
Integrated intensity maps in the 3 mm band observed with the IRAM 30m telescope towards the G183 region. The colour plot in each panel is the integrated emission of C18O(1–0) and the contours correspond to molecular transitions, as is indicated above the panels in units of K km s−1 with step sizes in brackets. Above each panel the contour levels are given to the right. The intensities are integrated between velocities of −12 to −2 km s−1, except for N2H+(1–0), which is integrated between −22 to 0 km s−1. In the top left panel, the region mapped at 1.4 mm is shown by the smaller box. Positions selected for further analysis are shown as ‘+’ in the bottom right panel and marked as S1 (0″, 0″), S2 (123″, −125″) and S3 (−15″, −96″). The solid curve drawn on the C18O(1–0) map shows the direction in which the velocity analysis including the position-velocity diagram (Fig. 5) was done. The HPBW is shown on the lower right.
Current usage metrics show cumulative count of Article Views (full-text article views including HTML views, PDF and ePub downloads, according to the available data) and Abstracts Views on Vision4Press platform.
Data correspond to usage on the plateform after 2015. The current usage metrics is available 48-96 hours after online publication and is updated daily on week days.
Initial download of the metrics may take a while.