Fig. 4
Download original image
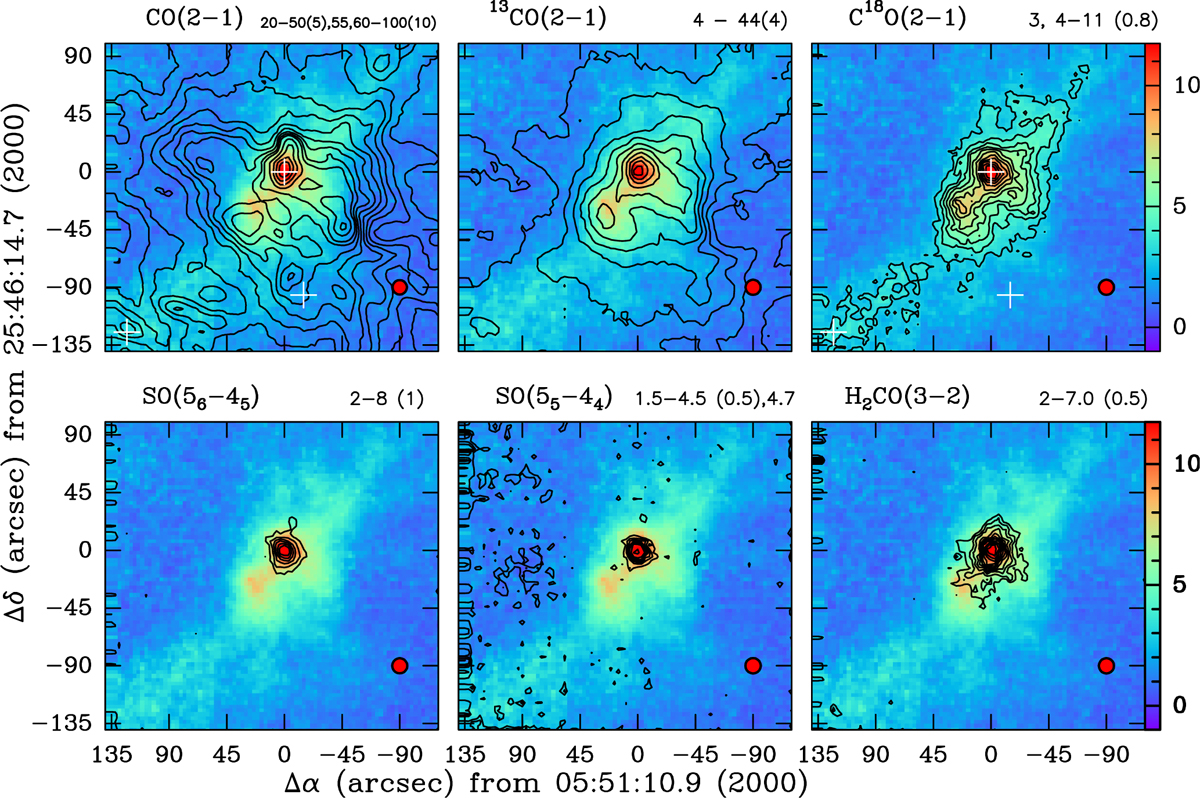
Integrated intensity maps at 1.4 mm observed with the IRAM 30m telescope towards the G183 region. The colour plot in each panel is the integrated emission of C18O(2–1) and the contours correspond to molecular transitions, as is indicated above the panels. The intensities are integrated between velocities of −20 to 0 km s−1. The HPBW is shown on the lower right.
Current usage metrics show cumulative count of Article Views (full-text article views including HTML views, PDF and ePub downloads, according to the available data) and Abstracts Views on Vision4Press platform.
Data correspond to usage on the plateform after 2015. The current usage metrics is available 48-96 hours after online publication and is updated daily on week days.
Initial download of the metrics may take a while.