Fig. 6
Download original image
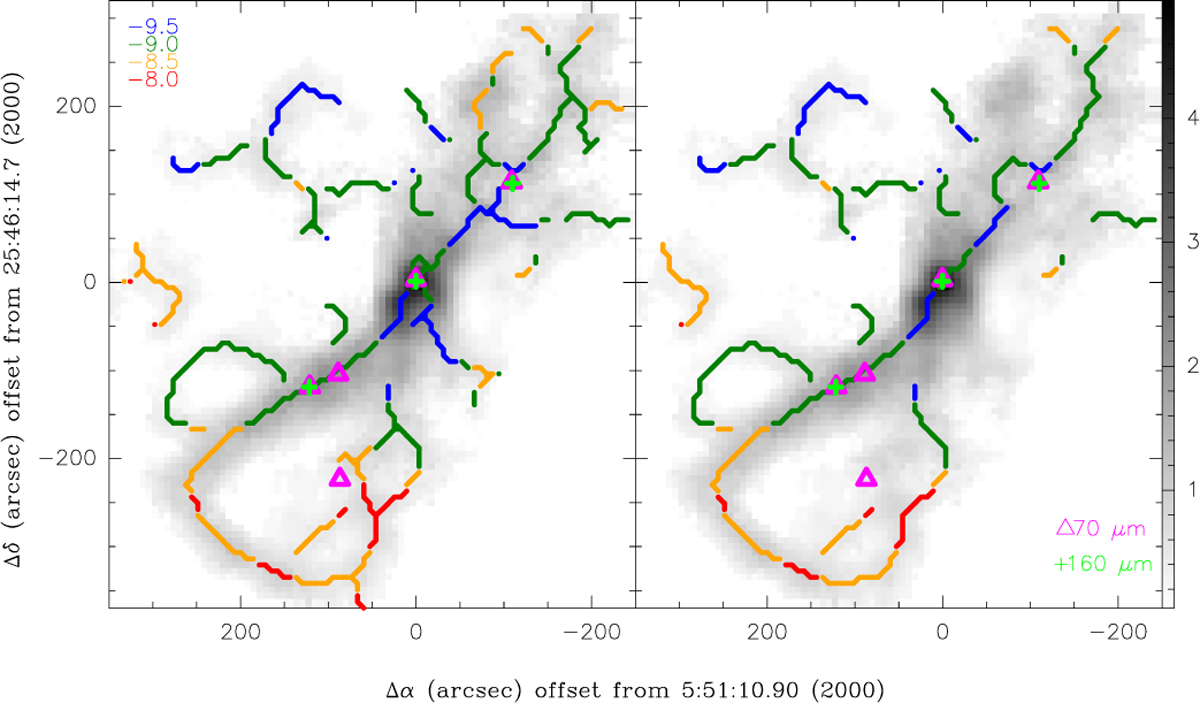
Velocity-coherent skeletons (left) and spines (right) identified using the automated tool CRISPY applied to the C18O(1–0) datacube. A skeleton is defined as a ridge that has been gridded onto an image and a spine as a skeleton with all its branches removed. The greyscale image in each panel corresponds to the intensity map of C18O(1–0) integrated over −11 to −4 km s−1 with S/N ratio >5. The continuously changing velocity centroids along the filaments are marked in different colours and the values are mentioned in the left panels. The triangle and +’ mark the positions of the 70 μm and 160 μm continuum sources, respectively.
Current usage metrics show cumulative count of Article Views (full-text article views including HTML views, PDF and ePub downloads, according to the available data) and Abstracts Views on Vision4Press platform.
Data correspond to usage on the plateform after 2015. The current usage metrics is available 48-96 hours after online publication and is updated daily on week days.
Initial download of the metrics may take a while.