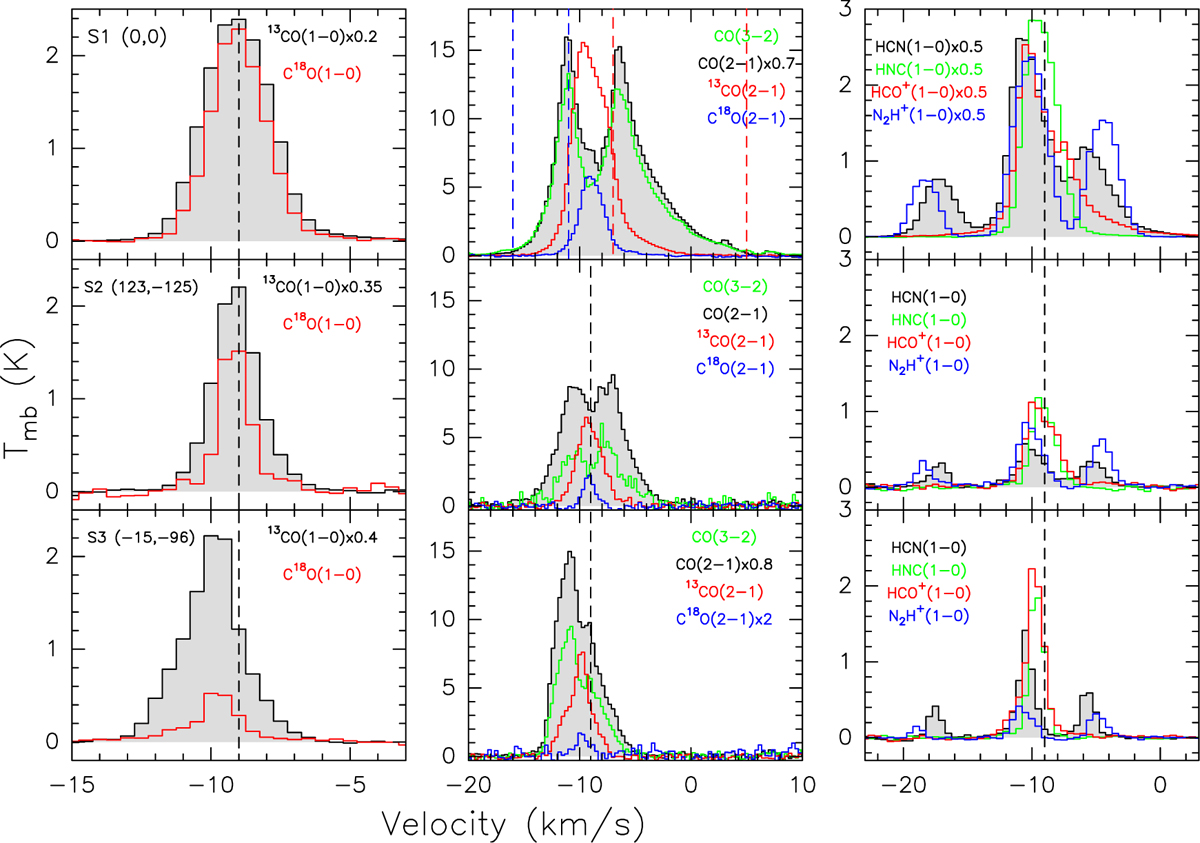
Fig. 7
Download original image
Comparison of spectra at selected positions (Fig. 2) in G183. Panels in top, middle, and bottom rows correspond to positions S1, S2, and S3 with offsets (in arcseconds) (0, 0), (−15, −96), and (123, −125) respectively. All 3 mm spectra are convolved to a common resolution of 28″, while the 1.4 mm spectra are convolved to a resolution of 14″. CO(3–2) has a native resolution of 15″. The vertical dashed line in the top row of the middle column panel shows the velocity ranges chosen for analysis of the blue and red wings of the spectra.
Current usage metrics show cumulative count of Article Views (full-text article views including HTML views, PDF and ePub downloads, according to the available data) and Abstracts Views on Vision4Press platform.
Data correspond to usage on the plateform after 2015. The current usage metrics is available 48-96 hours after online publication and is updated daily on week days.
Initial download of the metrics may take a while.