Fig. 1.
Download original image
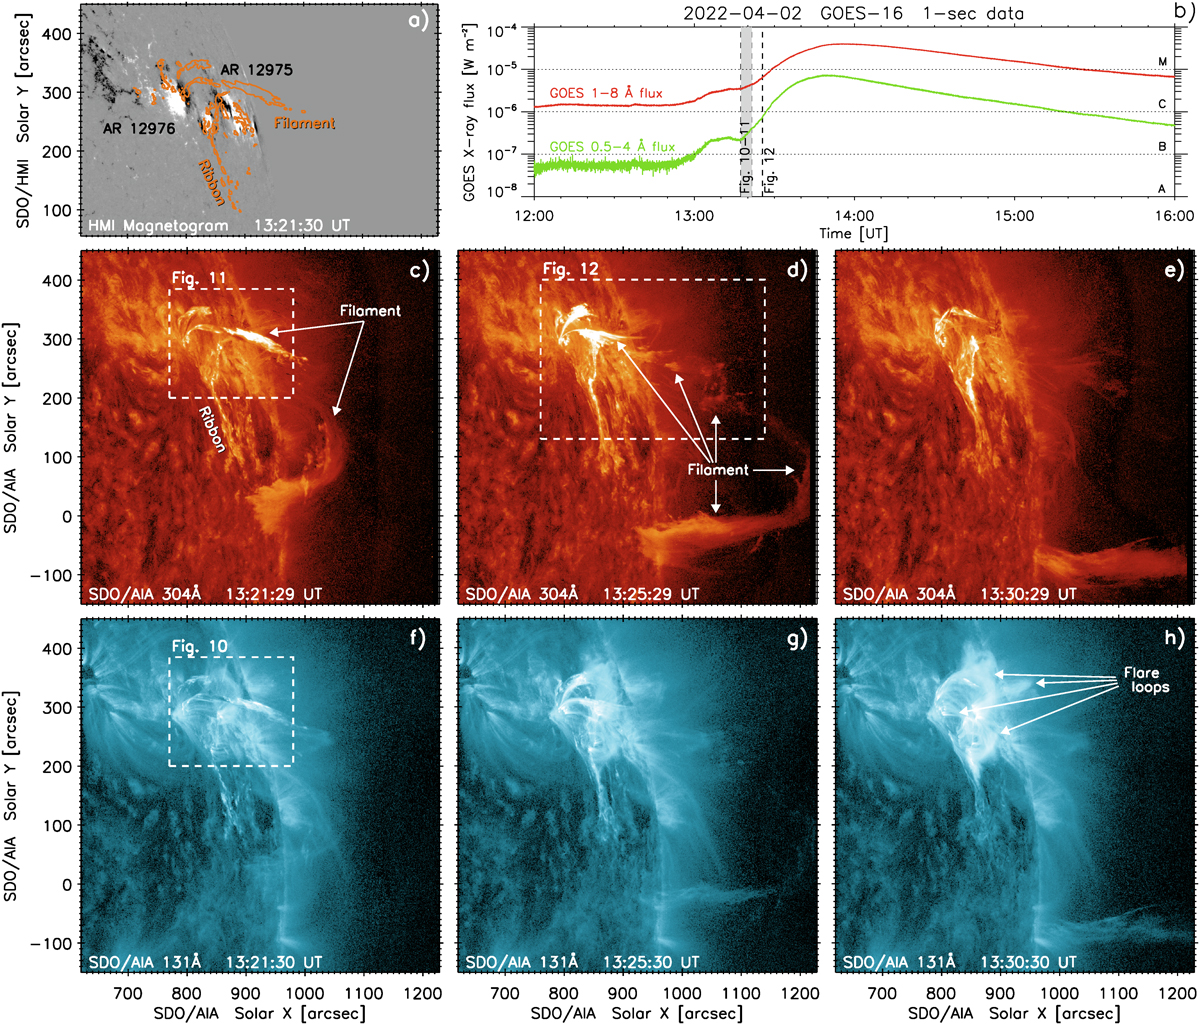
Overview of the filament eruption and accompanying flare. Panel (a): SDO/HMI magnetogram. Panel (b): GOES X-ray observations. Panels (c)–(h): SDO/AIA images in 304 Å (c–e) and 131 Å passbands (f–h). The filament and flare loops are indicated. The contour in panel (a) corresponds to 50 DN s−1 px−1 in 304 Å (panel c), showing the relative location of the erupting filament with respect to the photospheric polarities. Dashed and dotted lines indicate the times and the fields of view of Figs. 10, 11, 12. An animation of the SDO/AIA data is available online, spanning 12:50–13:55 UT.
Current usage metrics show cumulative count of Article Views (full-text article views including HTML views, PDF and ePub downloads, according to the available data) and Abstracts Views on Vision4Press platform.
Data correspond to usage on the plateform after 2015. The current usage metrics is available 48-96 hours after online publication and is updated daily on week days.
Initial download of the metrics may take a while.