Fig. 10.
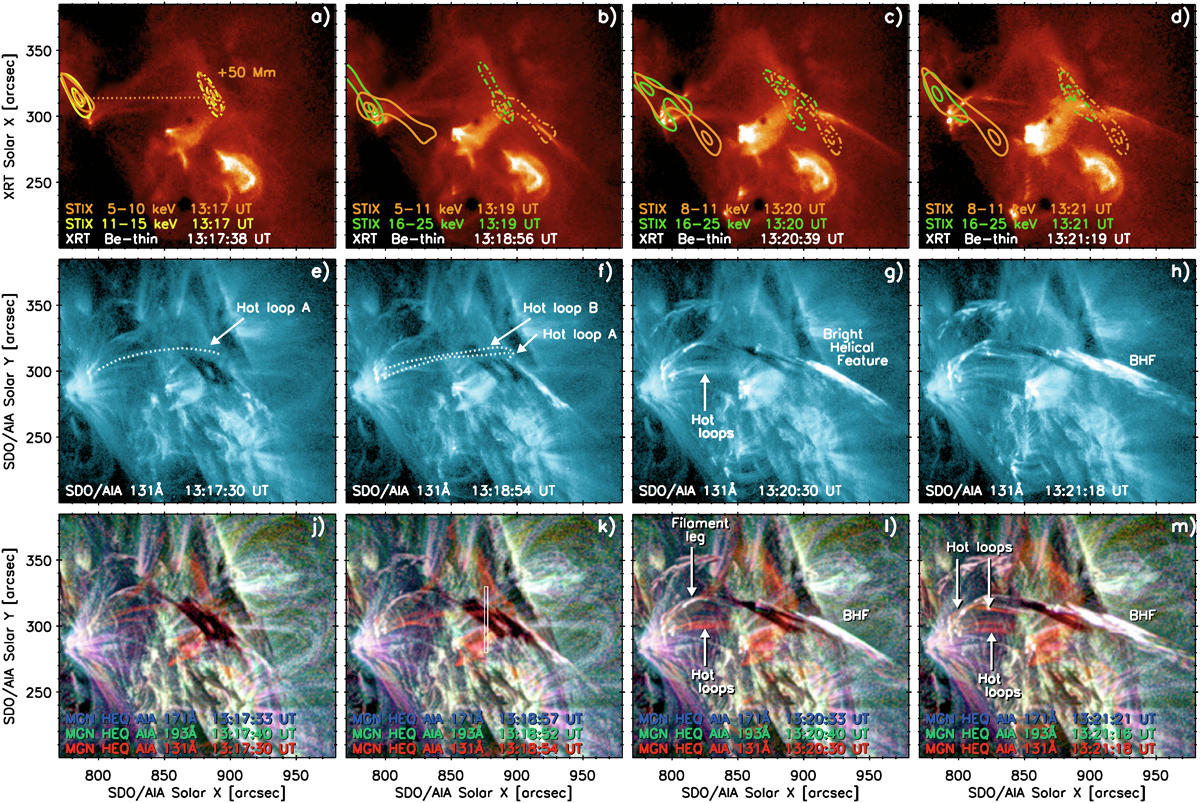
Download original image
Filament interaction with the hot arcade above. Dotted white curves denote hot loops A and B seen in XRT and AIA 131 Å. The BHF develops in their vicinity. Contours indicate 50 and 90% levels of the 5–10 keV and 11–15 keV STIX sources reprojected assuming 0 and 50 Mm height (full and dash-dotted lines, resp.). Bottom row: MGN composites of 131 Å (red), 193 Å (green), and 171 Å (blue). (k) slit position for the time–distance plot (Fig. 11a) in white. An animation of the MGN composites with the slit position during 13:10–13:30 UT is available online.
Current usage metrics show cumulative count of Article Views (full-text article views including HTML views, PDF and ePub downloads, according to the available data) and Abstracts Views on Vision4Press platform.
Data correspond to usage on the plateform after 2015. The current usage metrics is available 48-96 hours after online publication and is updated daily on week days.
Initial download of the metrics may take a while.