Fig. 11.
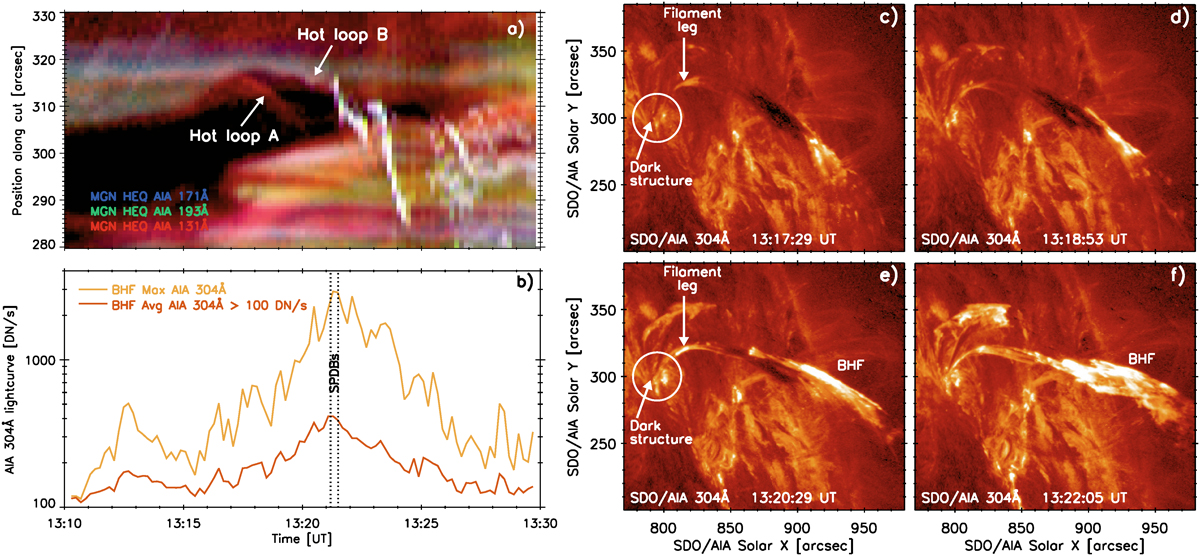
Download original image
Filament interaction with the hot arcade above. Panel (a): MGN time-distance plot along the slit (Fig. 10k). Panel (b): AIA 304 Å light curves for the maximum and average brightness within BHF. Vertical dotted lines mark the time of occurrence of the SPDBs (Table 1). Panels (c–f): BHF formation and movement of the filament leg with respect to the dark structure (white circle) in AIA 304 Å at similar times as in Fig. 10.
Current usage metrics show cumulative count of Article Views (full-text article views including HTML views, PDF and ePub downloads, according to the available data) and Abstracts Views on Vision4Press platform.
Data correspond to usage on the plateform after 2015. The current usage metrics is available 48-96 hours after online publication and is updated daily on week days.
Initial download of the metrics may take a while.