Fig. 12.
Download original image
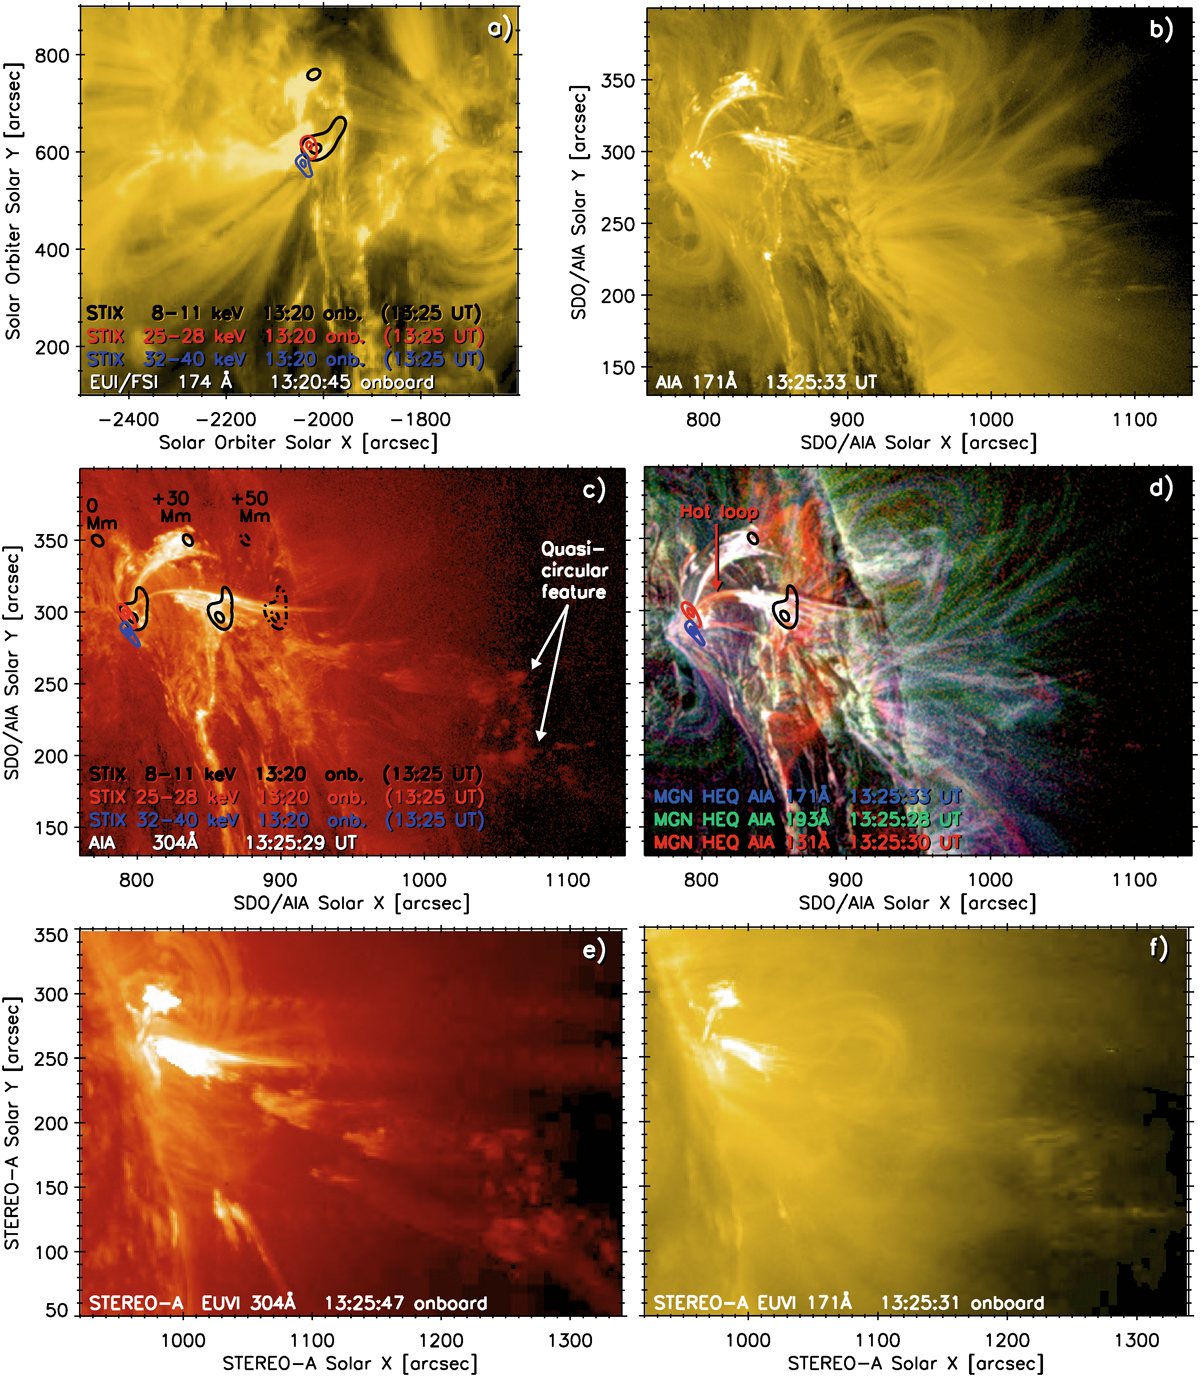
Extreme ultraviolet and X-ray observations of eruption around 13:25:30 UT (STIX time interval IV). Panel (a): Flare site at 13:20:45 EUI/FSI on board time (13:26:06 UT). Panels (b) and (c): SDO/AIA observations in the 171 and 304 AA channels, respectively. The quasi-circular feature is denoted by white arrows in (c). Panel (d): MGN composite of the 131 Å (red), 193 Å (green), and 171 Å (blue). An animation spanning 12:30–13:55 UT is available online. The red arrow points to a hot loop observed in 131 Å along the filament leg. Contours indicate 50 and 90 % levels of STIX sources over-plotted on EUI/FSI (a) and re-projected to AIA (c, d). The 8–11 keV sources is displayed for three assumed altitudes 0, 30, and 50 Mm in (c) but only for the 30 Mm altitude in (d). Panels (e) and (f): Complementary observations from STEREO-A/EUVI 304 Å and 171 Å. The quasi-circular feature is detectable in both passbands. An animation spanning 13:00–13:40 UT is available online.
Current usage metrics show cumulative count of Article Views (full-text article views including HTML views, PDF and ePub downloads, according to the available data) and Abstracts Views on Vision4Press platform.
Data correspond to usage on the plateform after 2015. The current usage metrics is available 48-96 hours after online publication and is updated daily on week days.
Initial download of the metrics may take a while.