Open Access
Fig. B.1.
Download original image
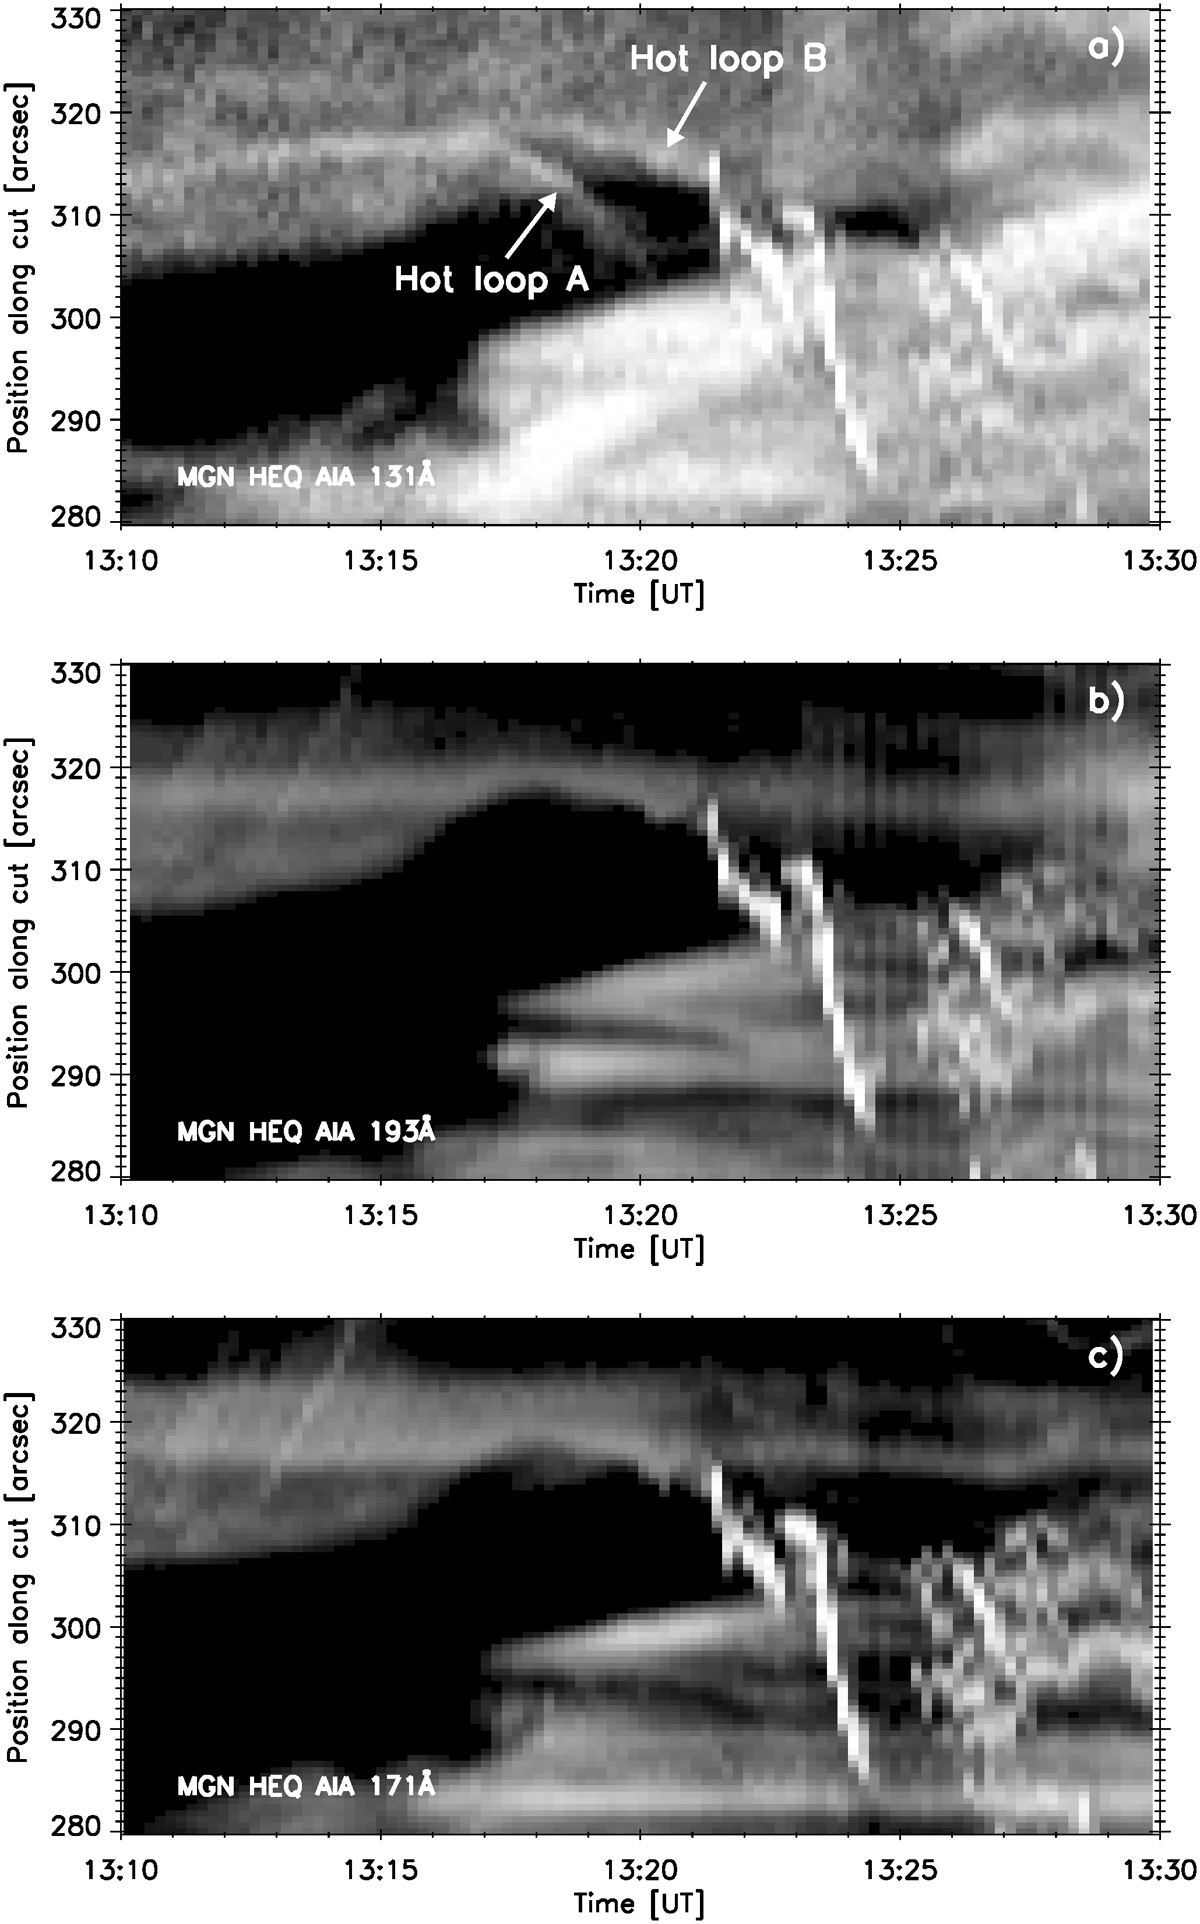
Separate layers of the MGN time-distance plot displayed in Fig. 11a. Panel a) clearly shows hot loops A and B in AIA 131 Å. Panels b) and c) do not show hot loop A at all in AIA 193 and 171 Å, respectively. Instead, background coronal emission is visible near the position of the hot loop B.
Current usage metrics show cumulative count of Article Views (full-text article views including HTML views, PDF and ePub downloads, according to the available data) and Abstracts Views on Vision4Press platform.
Data correspond to usage on the plateform after 2015. The current usage metrics is available 48-96 hours after online publication and is updated daily on week days.
Initial download of the metrics may take a while.