Fig. 8.
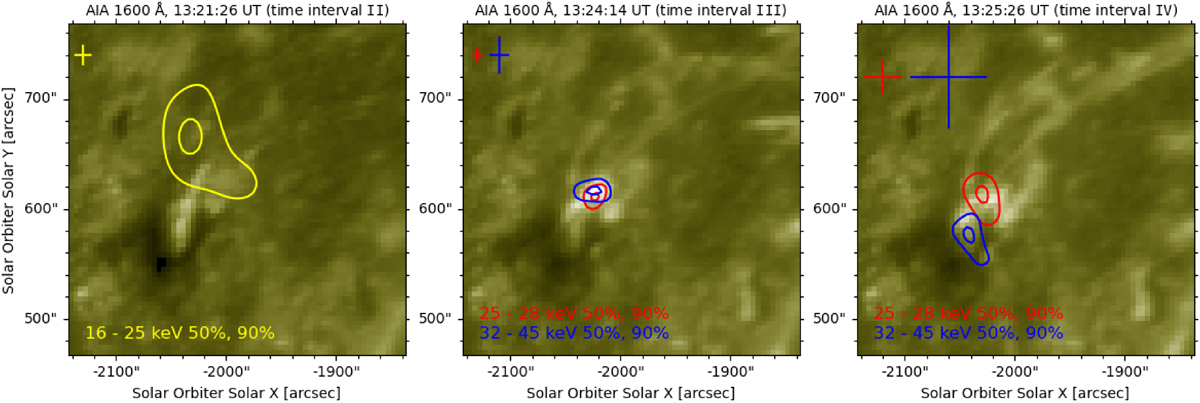
Download original image
Sources from STIX in 16–25 keV (yellow), 25–28 keV (red), and 32–45 keV (blue) ranges in the STIX time intervals II-IV overlayed on AIA 1600 Å images reprojected into Solar Orbiter view. Contours indicate 50 and 90 % levels of the peak flux in the STIX images, respectively. Error bars denote uncertainties of the STIX image centre of mass within the 50% contour. The field of view and intensity range are the same for all AIA images.
Current usage metrics show cumulative count of Article Views (full-text article views including HTML views, PDF and ePub downloads, according to the available data) and Abstracts Views on Vision4Press platform.
Data correspond to usage on the plateform after 2015. The current usage metrics is available 48-96 hours after online publication and is updated daily on week days.
Initial download of the metrics may take a while.