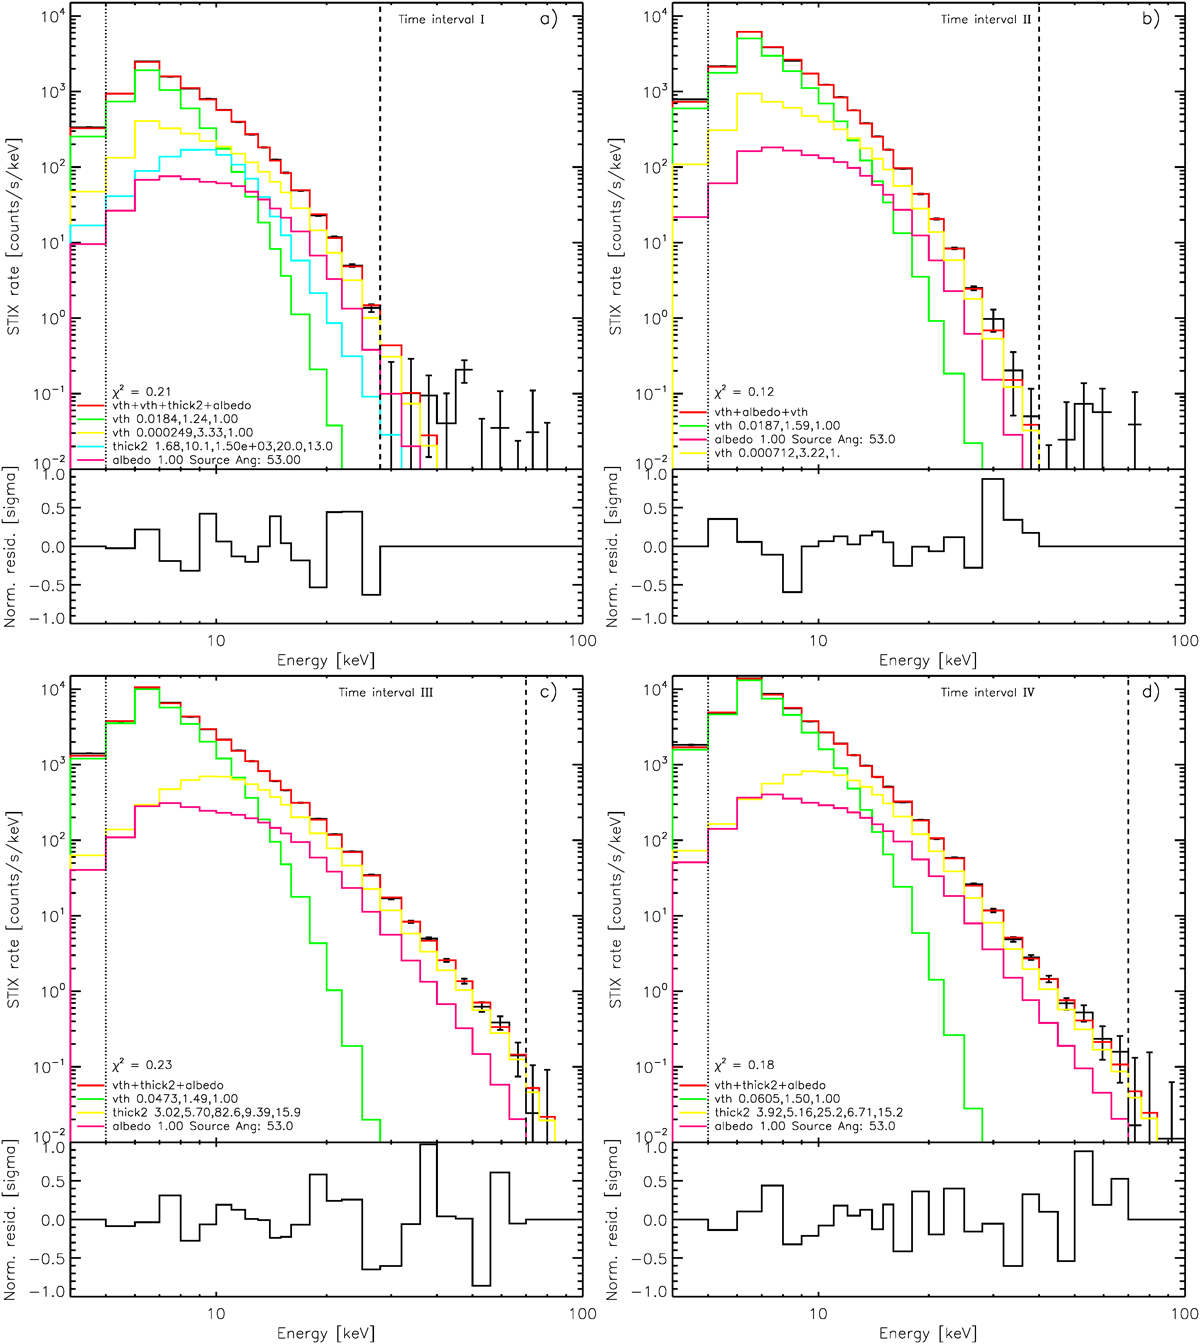
Fig. 9.
Download original image
STIX spatially integrated count rate spectra and fits in time intervals I–IV (a–d). Vertical error bars represent uncertainties. Dotted and dashed lines delimit the lower and upper energies used in the spectral fitting. The values of the reduced χ2 and the fitted parameters are indicated in the bottom left corners. For the thermal component vth these are emission measure [1049 cm−3], temperature [keV], and relative abundance; for the non-thermal component thick2 these are total electron flux [1035 electrons s−1], spectral index above the break energy, break energy [keV], spectral index below the break energy, and the low-energy cutoff [keV], resp. Panels below the fits show normalised residuals, i.e. scaled by the corresponding uncertainties, as a function of energy.
Current usage metrics show cumulative count of Article Views (full-text article views including HTML views, PDF and ePub downloads, according to the available data) and Abstracts Views on Vision4Press platform.
Data correspond to usage on the plateform after 2015. The current usage metrics is available 48-96 hours after online publication and is updated daily on week days.
Initial download of the metrics may take a while.